Co-reporter:Qiulan Zhang;Yongnian Ni
RSC Advances (2011-Present) 2017 vol. 7(Issue 63) pp:39833-39841
Publication Date(Web):2017/08/11
DOI:10.1039/C7RA05570F
The interactions of typical nitrofuran antibiotics, nitrofurazone (NFZ) and nitrofurantoin (NFT), with bovine serum albumin (BSA) have been studied using fluorescence and FT-IR spectroscopy, circular dichroism (CD), atomic force microscopy (AFM) and molecular docking investigation. The results revealed that the fluorescence of BSA was quenched by nitrofurans with a static quenching mechanism. The conformation of BSA was changed and unfolded with the addition of nitrofurans because the alpha-helix and beta-sheet were varied to beta-turn and random structure. This study also indicated that the impact on the conformational changes of BSA caused by NFZ was more conspicuous than that of NFT. The molecular simulation studies were carried out to clearly describe the nature of the interaction between nitrofurans and BSA.
Co-reporter:Xiaoyun Lin;Yanfang Wang;Wenhui He;Yongnian Ni;Serge Kokot
RSC Advances (2011-Present) 2017 vol. 7(Issue 86) pp:54460-54467
Publication Date(Web):2017/11/27
DOI:10.1039/C7RA11540G
Nanostructured Co3O4 with near-cubic morphology was synthesised using the solvothermal method, and a non-enzymatic electrochemical glucose sensor (Co3O4–CuNPs/Pt) was successfully constructed by dropping and potentiostatic depositing technologies. The obtained Co3O4 and Co3O4–CuNPs were characterised and investigated by X-ray powder diffraction, scanning electron microscopy, transmission electron microscopy, energy dispersive X-ray spectroscopy and X-ray photoelectron spectroscopy. Quantitative analysis of glucose was performed using the amperometric (i–t) method, and a plot of current difference versus concentration of glucose was linear in the range 0.5–336 μM, with a linear correlation coefficient (R2) of 0.9989 and limit of detection (LOD) of 0.43 μM. When the linear range was reduced to 0.5–76.5 μM, R2 and LOD were 0.9997 and 0.17 μM, respectively. The sensitivity of the sensor was evaluated as 3.58 × 10⁴ and 4.03 × 10⁴ μA μM−1 cm−2 for the above two linear ranges, respectively. This novel sensor produced satisfactory reproducibility and stability and was applied to monitor trace amounts of glucose in human serum samples.
Co-reporter:Ying Guo;Xiaoxiao Ding;Yongnian Ni
Analytical Methods (2009-Present) 2017 vol. 9(Issue 45) pp:6420-6429
Publication Date(Web):2017/11/23
DOI:10.1039/C7AY02021J
Lotus has been widely cultivated and consumed in Asia, Oceania and America, and it is not only used as an ornamental plant but also as a dietary staple. In this work, fingerprinting techniques based on NIR spectroscopy and HPLC chromatography were used to discriminate four important kinds of lotus seed cultivars, Xianglian, Jianlian, Ganlian and Hulian. By the use of the NIR spectra and the aid of genetic algorithm-partial least squares (GA-PLS) and principal component analysis (PCA), cored lotus seed samples were successfully discriminated into four cultivars. High performance liquid chromatographic (HPLC) characteristic peaks detected at different wavelengths can also be used for PCA analysis to differentiate the lotus seed cultivars. Furthermore, quantitative prediction analysis of total sugar, total polysaccharide, liensinine and rutin in cored lotus seed (liensinine and rutin are mainly in lotus plumule) can be successfully performed with the use of the combined data matrix of 30 common characteristic HPLC peaks and 37 GA-PLS selected NIR spectral variables (wavelengths). The results suggested that the combination of NIR and HPLC supported by chemometrics is suitable for the discrimination of the plant cultivars and quantitative prediction of the active constituents in lotus seed samples.
Co-reporter:Xiaoyun Lin;Yongnian Ni;Xueying Pei;Serge Kokot
Analytical Methods (2009-Present) 2017 vol. 9(Issue 7) pp:1105-1111
Publication Date(Web):2017/02/16
DOI:10.1039/C6AY03022J
An electrochemical biosensor capable of direct detection of DNA damage induced by clenbuterol (CLB) has been developed. A glassy carbon electrode (GCE) was modified using reduced graphene oxide-Nafion and dsDNA to produce a dsDNA/RGO-Nafion/GCE sensor. The modified electrode was characterized by electrochemical impedance spectroscopy (EIS) and cyclic voltammetry (CV), and the results at each stage of the electrode construction were interpreted. They indicated that the electrochemical oxidation peak currents of guanine and adenine at the electrode (dsDNA/RGO-Nafion/GCE) significantly increased as compared with those at the untreated electrode (dsDNA/GCE). Based on this, the sensor was used to measure the change of the oxidation peak currents for guanine and adenine between the intact and damaged dsDNA in the sensor films, and the DNA damage was successfully detected. Furthermore, the plot of peak current decline for the guanine and adenine versus the concentration of CLB was linear in the range of 5.0 × 10⁻⁷ to 4.0 × 10⁻⁶ mol L−1, with a limit of detection (LOD) of 3.2 × 10⁻⁷ mol L−1, which provided a good method to determine CLB indirectly.
Co-reporter:Qianfen Zhuang, Liming Sun, Yongnian Ni
Talanta 2017 Volume 164() pp:458-462
Publication Date(Web):1 March 2017
DOI:10.1016/j.talanta.2016.12.004
•The toxic melamine was transformed to graphitic carbon nitrides nanosheets (GCNNs).•The GCNNs was used to construct a fluorescence sensor for highly selective and sensitive detection of Hg2+.•The sensor was successfully employed for the detection of Hg2+ in the lake water and milk samples.A facile, simple, and relatively environment-friendly hydrothermal approach was developed for one-step synthesis of graphitic carbon nitride nanosheets (GCNNs) using melamine and sodium citrate as the precursors. The prepared GCNNs emit strong fluorescence with a high quantum yield of 48.3%. The GCNNs were then characterized by various techniques including transmission electron microscopy, atomic force microscopy, X–ray diffraction, Fourier transform infrared spectroscopy, and UV–Vis absorption spectroscopy. In addition, the fluorescence quenching behavior of the GCNNS by mercuric ions (Hg2+) was exploited to fabricate a label-free fluorescence quenching sensor for sensitive and selective detection of Hg2+. The results showed that there existed a linear relationship between the fluorescence intensity and the concentration of Hg2+ from 0.001 to 1.0 μM with a detection limit of 0.3 nM. Finally, the sensor was successfully used to detection of Hg2+ in water and milk samples.
Co-reporter:Xinrong Guo, Fangying Wu, Yongnian Ni, Serge Kokot
Analytica Chimica Acta 2016 Volume 942() pp:112-120
Publication Date(Web):26 October 2016
DOI:10.1016/j.aca.2016.08.047
•A strong red fluorescent nano-composite, g-C3N4 NSs-AuNCs, was synthesized and characterized.•The g-C3N4 NSs-AuNCs were used as sensor for analysis of dopamine (DA).•As comparison with g-C3N4 NSs, higher sensitivity and selectivity were obtained.•The quenching mechanism of the sensor for the analysis of dopamine was studied.•The sensor was for sensitive analysis of DA in spiked human serum and urine sample.A strong red fluorescent nanocomposite, consisting of graphite-like carbon nitride nanosheets (g-C3N4 NSs) and serum albumin-capped Au nanoclusters (AuNCs), was synthesized. Dopamine (DA) can quench the red fluorescence of the nanocomposite, based on the Forster resonance energy transfer (FRET) mechanism. In this quenching process, the energy is transferred from the fluorescent g-C3N4 NSs-AuNCs to the oxidized DA quinine molecules (DA is easily oxidated to form DA quinine in air). The red fluorescence emission at 420 nm decreases dramatically and the quenching ratio (F0 – F)/F0 is linearly related to the concentration of DA in the range of 0.05–8.0 μmol L−1 with a detection limit of 0.018 μmol L−1 (S/N = 3). Additionally, this sensor has a potential of application to assay the DA in the real samples, such as human serum and human urine.
Co-reporter:Yong Wang, Jie Hu, Qianfen Zhuang, and Yongnian Ni
ACS Sustainable Chemistry & Engineering 2016 Volume 4(Issue 5) pp:2535
Publication Date(Web):April 5, 2016
DOI:10.1021/acssuschemeng.5b01639
Fluorescent molybdenum disulfide (MoS2) nanosheets were synthesized hydrothermally by employing sodium molybdate and thiourea as the starting materials. Lead(II) ion was introduced as a chemical dopant into the fluorescent nanosheets for the first time, and it was found that the fluorescence of the doped MoS2 nanosheets showed a considerable enhancement compared with that of initial MoS2 nanosheets, implying that lead(II)-doping into the MoS2 nanosheets could result in an increase in the fluorescence quantum yield. In parallel, we exploited the lead(II)-induced fluorescence enhancement of MoS2 nanosheets to design a green and facile fluorescent “turn on” nanosensor for lead(II) detection. Moreover, we found that the fluorescent intensity of the doped MoS2 nanosheets was drastically quenched by the successive addition of sulfide ions. Hence, the “turn off” process was used to fabricate a green fluorescence quenching sensor for detection of sulfide ions. Finally, we elucidated the origin of the lead(II)-induced fluorescence enhancement and sulfide-induced fluorescence reduction by using various analytical techniques like scanning electron microscopy, transmission electron microscopy, X-ray photoelectron spectroscopy, X-ray diffraction, Fourier transform infrared spectroscopy, and UV–vis spectroscopy. The work not only opens a door for the further development of new approaches for the preparation of various fluorescent layered transition metal dichalcogenides with high quantum yields but also provides a versatile and sustainable sensing platform for ion detection.Keywords: Lead; Luminescence; Molybdenum disulfide nanoflakes; Sensors; Sulfide; Two-dimensional materials;
Co-reporter:Qiulan Zhang, Yongnian Ni and Serge Kokot
Analyst 2016 vol. 141(Issue 7) pp:2218-2227
Publication Date(Web):12 Feb 2016
DOI:10.1039/C5AN02420J
The interactions of the sugars glucose and lactose with the transport protein bovine serum albumin (BSA) were investigated using fluorescence, FT-IR and circular dichroism (CD) techniques. The results indicated that glucose could be bonded and transported by BSA, mainly involving hydrogen bonds and van der Waals interactions (ΔH = −86.13 kJ mol−1). The obtained fluorescence data from the binding of sugar and BSA were processed by the multivariate curve resolution-alternating least squares (MCR-ALS) method, and the extracted concentration profiles showed that the equilibrium constant, rglucose:BSA, was about 7. However, the binding of lactose to BSA did not quench the fluorescence significantly, and this indicated that lactose could not be directly transported by BSA. The binding experiments were further performed using the fluorescence titration method in the presence of calcium and BSA. Calcium was added so that the calcium/BSA reactions could be studied in the presence or absence of glucose, lactose or hydrolysis products. The results showed that hydrolyzed lactose seemed to enhance calcium absorption in bovine animals. It would also appear that for children, lactose provides better nutrition; however, glucose is better for adults.
Co-reporter:Jie Hu, Qianfen Zhuang, Yong Wang and Yongnian Ni
Analyst 2016 vol. 141(Issue 5) pp:1822-1829
Publication Date(Web):19 Jan 2016
DOI:10.1039/C5AN02457A
In this work, we developed a novel layered molybdenum disulfide (MoS2) nanosheet peroxidase mimetic-based fluorescent catalytic biosensor for the sensitive and selective detection of Fe2+. It was found that Fe2+ remarkably enhanced the catalytic activity of the MoS2 nanosheet for oxidation of OPD to form a highly fluorescent substance, 2,3-diaminophenazine (DAPN), and the MoS2/OPD/H2O2 biosensor displayed substantial fluorescence enhancement after addition of Fe2+ in a concentration-dependent manner. The fluorescence intensity was proportional to the concentration of Fe2+ over a range of 0.005–0.20 μM with a limit of detection of 3.5 nM (signal/noise = 3). When compared with the OPD/H2O2 biosensor, the MoS2/OPD/H2O2 biosensor provided a higher sensitivity and selectivity for Fe2+, suggesting the validity of the use of the MoS2 nanosheets. To further demonstrate the feasibility of the MoS2/OPD/H2O2 biosensor for Fe2+ detection in real water samples, we measured the three-dimensional excitation–emission spectra of the real system, and submitted the excitation–emission matrix (EEM) data to an advanced chemometrics model based on parallel factor analysis (PARAFAC). The results showed that the use of the PARAFAC model could further enhance the selectivity of the biosensor and determine Fe2+ concentration in the presence of unexpected interferents from real water samples. This work opens up new opportunities for the use of the catalytic properties of the MoS2 nanosheets and advanced chemometrics models in the field of biosensors.
Co-reporter:Ying Guo, Yongnian Ni, Jinfeng Chen and Serge Kokot
Analytical Methods 2016 vol. 8(Issue 1) pp:197-204
Publication Date(Web):11 Nov 2015
DOI:10.1039/C5AY02191J
An uncomplicated and sensitive kinetic spectrofluorometric method was developed for the simultaneous analysis of sibutramine, indapamide, and hydrochlorothiazide commonly found in weight-reducing health foods. The mentioned compounds were oxidized by cerium(IV) ammonium sulfate dissolved in an acidic solution. The kinetic-fluorescence spectrum of the produced cerium(III) was recorded between 0 and 600 s reaction time at the excitation wavelength of 250 nm. It was found that the fluorescence intensity was proportional to the concentration of the compounds, and their linear ranges were 0.005–0.12, 0.03–1.44 and 0.01–0.20 μg mL−1; the corresponding detection limits were 1.6, 8.3 and 6.0 ng mL−1 for sibutramine, indapamide and hydrochlorothiazide, respectively. The measured three- and two-way data of the mixtures were processed by chemometrics (included methods: parallel factor analysis (PARAFAC), partial least squares (PLS), principal component regression (PCR), and radial basis function-artificial neural network (RBF-ANN)). The proposed method was applied for the simultaneous determination of the analytes in weight-reducing food samples, and the results were comparable with those from the reference HPLC method.
Co-reporter:Xiaoxiao Ding, Ying Guo, Yongnian Ni, Serge Kokot
Vibrational Spectroscopy 2016 Volume 82() pp:1-9
Publication Date(Web):January 2016
DOI:10.1016/j.vibspec.2015.10.004
•Dehydrated tomatoes from different origins were discriminated by the use of NIR data.•Satisfactory classification of the dehydrated tomatoes were obtained.•Lycopene, total acid, sugar, phenols and antioxidant activity were determined with sufficient accuracy.Near-infrared (NIR) spectroscopy is a well-known, rapid and non-destructive technique suitable for analyses of many different food products. In this work, it was used to develop a novel method for the analysis of dehydrated tomato samples, collected from four different producers. The NIR spectra from such samples were discriminated according to the four production sources, with the use of principal component analysis (PCA). Also, hierarchical cluster analysis (HCA), linear discriminant analysis (LDA) and K-nearest neighbors (KNN) were successfully used for pattern recognition. The prediction rates were 100% for assigning producers to samples. Two multivariate calibration models—partial least squares regression (PLSR) and radial basis function neural networks (RBF-NN), were applied for quantitative analysis. NIRS calibration models were established for the determination of lycopene and total acid, sugar, phenols and antioxidant activity in dehydrated tomatoes. These calibrations were then used for prediction of unknown, dehydrated tomato samples with satisfactory results. The RBF-NN results were better than those obtained from the PLSR models, and the better predictions suggested that the novel NIR spectroscopic method supported by chemometrics, is suitable for the discrimination and prediction of the five quality parameters in the dehydrated tomato products.
Co-reporter:Xiaoyun Lin, Yongnian Ni, Serge Kokot
Sensors and Actuators B: Chemical 2016 Volume 233() pp:100-106
Publication Date(Web):5 October 2016
DOI:10.1016/j.snb.2016.04.019
•Construction of the Chox/MoS2-AuNPs/GCE biosensor.•MoS2 and AuNPs have a synergistic catalytic effect on cholesterol.•Quantitative analysis of cholesterol in egg yolk and pork liver samples.•To provide a new method for detecting cholesterol.A novel modified electrode has been successfully constructed with the use of a nano-composite mixture consisting of molybdenum disulfide (MoS2) and gold nanoparticles (AuNPs). Its application as a cholesterol biosensor was investigated. The morphology of the prepared MoS2-AuNPs nanoparticles were characterized by scanning electron microscopy (SEM), transmission electron microscopy (TEM), atomic force microscope (AFM), X-ray diffraction (XRD) and energy dispersive X-ray spectroscopy (EDS). The physicochemical properties of the modified electrode at each stage of the construction were characterized by electrochemical impedance spectroscopy (EIS) and cyclic voltammetry (CV). Quantitative analysis of cholesterol was carried out with the use of the amperometric i–t method, and the calibration plot for cholesterol was linear in the range of 0.5–48 μM with a limit of detection (LOD) of 0.26 ± 0.015 μM. The apparent Michaelis-Menten constant (KMapp) and sensitivity were estimated to be 0.325 mM and 4460 μA mM−1 cm−2, respectively. This novel sensor produced satisfactory reproducibility and stability, and was used successfully for the quantitative analysis of cholesterol in egg yolk and pork liver samples.
Co-reporter:Qianfen Zhuang;Yong Wang;Yongnian Ni
Luminescence 2016 Volume 31( Issue 3) pp:746-753
Publication Date(Web):
DOI:10.1002/bio.3019
Abstract
The work demonstrated that solid citric acid, one of the most common food additives, can be converted to graphene quantum dots (GQDs) under microwave heating. The as-prepared GQDs were further characterized by various analytical techniques like transmission electron microscopy, atomic force microscopy, X-ray diffraction, X–ray photoelectron spectroscopy, Fourier transform infrared spectroscopy, fluorescence and UV-visible spectroscopy. Cytotoxicity of the GQDs was evaluated using HeLa cells. The result showed that the GQDs almost did not exhibit cytotoxicity at concentrations as high as 1000 µg mL–1. In addition, it was found that the GQDs showed good solubility, excellent photostability, and excitation-dependent multicolor photoluminescence. Subsequently, the multicolor GQDs were successfully used as a fluorescence light-up probe for live-cell imaging. Copyright © 2015 John Wiley & Sons, Ltd.
Co-reporter:Ying Guo, Yongnian Ni, Serge Kokot
Spectrochimica Acta Part A: Molecular and Biomolecular Spectroscopy 2016 Volume 153() pp:79-86
Publication Date(Web):15 January 2016
DOI:10.1016/j.saa.2015.08.006
•Evaluate the quality of jujube fruit samples by NIR spectroscopy and chemometrics•Quantitative analysis of sugar, acid, phenol and antioxidant activity in jujubes•Pattern recognitions were successfully applied for discrimination of jujube fruits.Near-infrared spectroscopy (NIRS) calibrations were developed for the discrimination of spectra of the jujube (Zizyphus jujuba Mill.) fruit samples from four geographical regions. Prediction models were developed for the quantitative prediction of the contents of jujube fruit, i.e., total sugar, total acid, total phenolic content, and total antioxidant activity. Four pattern recognition methods, principal component analysis (PCA), linear discriminant analysis (LDA), least squares-support vector machines (LS-SVM), and back propagation-artificial neural networks (BP-ANN), were used for the geographical origin classification. Furthermore, three multivariate calibration models based on the standard normal variate (SNV) pretreated NIR spectroscopy, partial least squares (PLS), BP-ANN, and LS-SVM were constructed for quantitative analysis of the four analytes described above. PCA provided a useful qualitative plot of the four types of NIR spectra from the fruit. The LS-SVM model produced best quantitative prediction results. Thus, NIR spectroscopy in conjunction with chemometrics, is a very useful and rapid technique for the discrimination of jujube fruit.By the aid of chemometrics, NIR spectroscopy calibrations were developed for the discrimination of the jujube fruit samples from four geographical regions, and quantitative prediction of their contents, i.e., total sugar, total acid, total phenolic content, and total antioxidant activity, were performed.
Co-reporter:Xiaoyun Lin, Yongnian Ni, Serge Kokot
Biosensors and Bioelectronics 2016 Volume 79() pp:685-692
Publication Date(Web):15 May 2016
DOI:10.1016/j.bios.2015.12.072
•Construction of the CuNFs-MoS2/GCE non-enzymatic biosensor.•CuNFs and MoS2 have a synergistic catalytic effect on H2O2 and glucose.•Quantitative analysis of H2O2 in tap water and glucose in human serum samples.•To provide an effective sensing platform for small biological molecules.A novel 3D nano-flower-like Cu/multi-layer molybdenum disulfide composite (CuNFs/MoS2) modified glassy carbon electrode (GCE) has been successfully constructed. It was a highly sensitive and selective non-enzymatic hydrogen peroxide (H2O2) and glucose biosensor. The morphology of the obtained CuNFs-MoS2 nano-particles was investigated with the use of a scanning electron microscopy (SEM), transmission electron microscopy (TEM), X-ray diffraction (XRD) and energy dispersive X-ray spectroscopy (EDS). The physicochemical properties of the modified electrode were characterized at each of the construction stages with the use of an electrochemical impedance spectroscopy (EIS) and cyclic voltammetry (CV) techniques. The new sensor combined the advantages of MoS2 and CuNFs, and exhibited high electro-catalytic activity toward H2O2 and glucose. Quantitative analysis of H2O2 and glucose was carried out with the use of the amperometric i–t method. Linear ranges were obtained between 0.04–1.88 μM and 1.88–35.6 μM for H2O2 and 1–20 μM and 20–70 μM for glucose, and their corresponding limits of detection (LOD) were 0.021 μM and 0.32 μM. This novel sensor was successfully applied for the quantitative analysis of H2O2 in tap water and glucose in human serum samples.
Co-reporter:Xiaoyun Lin, Yongnian Ni, Serge Kokot
Analytica Chimica Acta 2015 Volume 867() pp:29-37
Publication Date(Web):31 March 2015
DOI:10.1016/j.aca.2015.02.050
•A new method for detecting DNA damage was successfully developed.•A novel biosensor, MB/dsDNA/GO-CS/AuNPs/GCE biosensor was constructed.•Loading/release of MB in/out of dsDNA/GO-CS/AuNPs film was investigated.•DNA damage induced by BPA, NP and OP was detected and estimated.An electrochemical biosensor capable of indirect detection of DNA damage induced by any one of the three endocrine-disrupting compounds (EDCs) – bisphenol A (BPA), 4-nonylphenol (NP) and 4-t-octylphenol (OP), has been researched and developed. The methylene blue (MB) dye was used as the redox indicator. The glassy carbon electrode (GCE) was modified by the assembled dsDNA/graphene oxide-chitosan/gold nano-particles to produce a dsDNA/GO-CS/AuNPs/GCE sensor. It was characterized with the use of electrochemical impedance spectroscopy (EIS), cyclic voltammetry (CV) and scanning electron microscopy (SEM) techniques. The loading/release of the MB dye by the dsDNA/GO-CS/AuNPs film was investigated, and the results showed that the process was reversible. Based on this, the sensor was used to measure the difference between the loading capabilities of intact and damaged dsDNA in the films. The sensor was then successfully applied to detect DNA damage electrochemically. The differential pulse voltammetry (DPV) peak current ratio for MB, observed before and after DNA damage, increased linearly in the presence the BPA, NP or OP compounds; the treatment range was 10–60 min, and the respective damage rates were 0.0069, 0.0044 and 0.0031 min−1, respectively. These results were confirmed by the binding constants: 2.09 × 10⁶ M−1 (BPA-DNA), 1.28 × 10⁶ M−1 (NP-DNA) and 9.33 × 10⁵ M−1 (OP-DNA), all of which were obtained with the use of differential pulse stripping voltammetry (DPSV).
Co-reporter:Xinrong Guo, Yong Wang, Fangying Wu, Yongnian Ni and Serge Kokot
Analyst 2015 vol. 140(Issue 4) pp:1119-1126
Publication Date(Web):12 Dec 2014
DOI:10.1039/C4AN01950D
Molybdenum disulfide (MoS2) is an emerging material with some unique physical and electronic properties somewhat comparable to those of graphene. It was prepared with the use of a simple hydrothermal process, and has a layered structure similar to that of graphene. Also, it has a peroxidase-like catalytic activity and is able to catalyze the oxidation of the colorless peroxidase substrate, 3,3′,5,5′-tetramethylbenzidine (TMB), in the presence of H2O2 to produce a blue product. This reaction used MoS2 as a useful peroxidase, which involved a colorimetric method for trace analysis of H2O2 in water, e.g. lake waters. This method is uncomplicated, inexpensive and highly sensitive for H2O2 in the 0.125–1.75 μM range (LOD: 0.08 μM). It is also quite stable in the presence of many common inorganic and organic potentially interfering compounds, e.g. metal ions as well as amino acids and sugars.
Co-reporter:Yong Jiang;Yongnian Ni
Journal of Separation Science 2015 Volume 38( Issue 3) pp:418-425
Publication Date(Web):
DOI:10.1002/jssc.201400634
A method was developed for the determination of clenbuterol in meat using stable-isotope-dilution gas chromatography with mass spectrometry coupled with solid-phase microextraction and on-fiber derivatization. The samples were first homogenized with hydrochloric acid followed by protein deposition. After headspace solid-phase microextraction and on-fiber derivatization, the content of clenbuterol was measured with the aid of stable-isotope dilution. The condition of solid-phase microextraction was optimized by central composite design. The relative standard deviations, limit of detection, and recoveries for clenbuterol were 4.2–9.2%, 0.48 μg/kg, and 96–104%, respectively. The proposed method was satisfactory for analysis of real samples as compared with the Chinese standard method.
Co-reporter:Wenjiang Dong;Yongnian Ni;Serge Kokot
Journal of Separation Science 2015 Volume 38( Issue 3) pp:402-409
Publication Date(Web):
DOI:10.1002/jssc.201401130
In this study, complex substances such as Mint (Mentha haplocalyx Briq.) samples from different growing regions in China were analyzed for phenolic compounds by high-performance liquid chromatography with diode array detection and for the volatile aroma compounds by gas chromatography with mass spectrometry. Chemometrics methods, e.g. principal component analysis, back-propagation artificial neural networks, and partial least squares discriminant analysis, were applied to resolve complex chromatographic profiles of Mint samples. A total of 49 aroma components and 23 phenolic compounds were identified in 79 Mint samples. Principal component analysis score plots from gas chromatography with mass spectrometry and high-performance liquid chromatography with diode array detection data sets showed a clear distinction among Mint from three different regions in China. Classification results showed that satisfactory performance of prediction ability for back-propagation artificial neural networks and partial least squares discriminant analysis. The major compounds that contributed to the discrimination were chlorogenic acid, unknown 3, kaempherol 7-O-rutinoside, salvianolic acid L, hesperidin, diosmetin, unknown 6 and pebrellin in Mint according to regression coefficients of the partial least squares discriminant analysis model. This study indicated that the proposed strategy could provide a simple and rapid technique to distinguish clearly complex profiles from samples such as Mint.
Co-reporter:Yong Wang, Qianfen Zhuang, Yongnian Ni
Journal of Electroanalytical Chemistry 2015 Volume 736() pp:47-54
Publication Date(Web):1 January 2015
DOI:10.1016/j.jelechem.2014.10.028
•Novel nanomaterials, MoS2, was used in the area of electroanalytical chemistry.•ssDNA and graphene were exploited as an adhesive for binding MoS2 with Au electrode.•The novel rMoS2–graphene/A32/Au electrode possessed a high conductivity.•Riboflavin was analyzed by the modified electrode with the use of DPV voltammetry.•The electrode presented a wide linear range, high sensitivity, and good stability.Very recently, the interest in layered transition metal chalcogenides, especially molybdenum disulfide (MoS2), has been growing as quickly as interest in two-dimensional graphene did a few years ago because they share many impressive physicochemical properties of graphene. For the first time, we herein attempted to exploit 32-mer homoadenine ssDNA oligonucleotides (A32) and graphene as an effective anchoring block for attachment to the layered MoS2 and the Au electrode, and then the MoS2 binding with the Au electrode was electrochemically reduced to form the reduced MoS2 (rMoS2). The morphology and electrochemistry of the obtained rMoS2–graphene/A32/Au electrode were characterized by various techniques such as scanning electron microscopy, energy-dispersive X-ray spectroscopy, cyclic voltammetry, and electrochemical impedance spectroscopy. To show the electrochemical sensing performance of the modified electrode, riboflavin was selected as model target. The results displayed that the riboflavin sensor with the use of differential pulse voltammetry possessed a wide linear range from 0.025 to 2.25 μM, with a low detection limit of 20 nM. The sensor was then successfully employed for the detection of riboflavin in human urine samples.
Co-reporter:Xiaoxiao Ding, Yongnian Ni, Serge Kokot
Chemometrics and Intelligent Laboratory Systems 2015 Volume 144() pp:17-23
Publication Date(Web):15 May 2015
DOI:10.1016/j.chemolab.2015.03.004
•The pure and adulterated sweet potato samples were discriminated by chemometrics.•The NIR data of sweet potato samples were pretreated by SNV/SPA to select the variables.•Quantification of total anthocyanin and antioxidant activity was carried out by RBF-PLS.This work demonstrates how near-infrared reflectance spectroscopy (NIR) in combination with chemometrics can be used to analyse and discriminate powdered, pure and adulterated sweet potato samples. Thus, the principal component analysis (PCA) method, which is able to produce diagrams of objects as a function of PC scores, was able to distinguish and group the NIRS from the many different types of potato sample. Other methods such as the radial basis function-partial least squares (RBF-PLS) as well the successive projection algorithm (SPA) combination, distinguished the purple and white sweet potato varieties from each other as well as, importantly, from the different adulterated purple sweet potato samples. Furthermore, the total anthocyanin (TA) and total antioxidant activity (TAA) parameters were also analysed quantitatively in these samples, and high residual prediction deviation (RPD) values were noted. Also, the two recognition methods, k-nearest neighbours (KNN) and linear discriminant analysis (LDA), were able to discriminate the sweet potato samples. Thus, overall this work demonstrated that NIRS combined with chemometrics methods can be employed for the identification of purple sweet potato, white sweet potato and their adulterated samples; in addition, quantitative analysis for TA and TAA in such samples can be successfully performed.
Co-reporter:Qiulan Zhang, Yongnian Ni and Serge Kokot
Analytical Methods 2015 vol. 7(Issue 11) pp:4514-4520
Publication Date(Web):20 Apr 2015
DOI:10.1039/C5AY00488H
A novel, uncomplicated method for the analysis of lead (Pb2+) and mercury (Hg2+) ions has been developed with the use of gold nano-rods (AuNRs), which were combined with ssDNA. The AuNR–ssDNA assembly was stabilized by electrostatic interactions. The ssDNA has a random coil structure, which was changed to G-quartet and hairpin-like structures after binding with Pb2+ and Hg2+ ions, respectively. The bonding with lead and mercury caused the ssDNA assembled AuNRs (ssDNA–AuNRs) to disperse, and this increased the surface plasmon resonance (SPR) absorption of the AuNRs. Changes in the UV-vis spectral intensities allowed the selective detection of Pb2+ and Hg2+ ions at concentrations as low as 19.8 nM and 3.2 nM, respectively. Linear correlations were observed between the UV-vis spectra and the Pb2+ and Hg2+ analytes in the concentration ranges of 25–250 nM (R2 = 0.9971) for Pb2+ and 4–40 nM (R2 = 0.9956) for Hg2+, respectively. The literature suggests that the novel method is another example in which the ssDNA–AuNR assembly has been used for trace analysis of Pb2+ and Hg2+.
Co-reporter:Xiaoxiao Ding, Yongnian Ni and Serge Kokot
Analytical Methods 2015 vol. 7(Issue 3) pp:961-969
Publication Date(Web):02 Dec 2014
DOI:10.1039/C4AY02115K
Flos Chrysanthemum tea contains flavonoids, essential oils and caffeoylquinic acids. These substances are pharmacologically active but this activity is cultivar dependent. Seventy-six Flos Chrysanthemum samples collected from four cultivars (Hangju, Taiju, Gongju and Boju) were discriminated with the use of results from high performance liquid chromatography (HPLC) and gas chromatography-mass spectrometry (GC-MS). A two-dimensional chromatographic fingerprint dataset of the four kinds of Flos Chrysanthemum cultivar was built from the combined GC/HPLC profiles and thirty variables were selected. Principal component analysis (PCA) and kernel – PCA (KPCA) were used for feature extraction. The score mapping graph indicated that these two PCA methods effectively extracted most information from the samples, and the four Flos Chrysanthemum cultivars were qualitatively differentiated. Furthermore, four supervised pattern recognition techniques, radial basis function-neural network analysis (RBF-NN), least squares support vector machines (LS-SVM), linear discriminant analysis (LDA) and K-nearest neighbors (KNN), successfully predicted the validation of the samples.
Co-reporter:Yong Wang;Yao Gu;Yongnian Ni;Serge Kokot
Luminescence 2015 Volume 30( Issue 7) pp:940-946
Publication Date(Web):
DOI:10.1002/bio.2841
Abstract
Variations in the enzyme activity of acetylcholinesterase (AChE) in the presence of the nano-material, graphene oxide (GO), were investigated with the use of molecular spectroscopy UV-visible and fluorescence methods. From these studies, important kinetic parameters of the enzyme were extracted; these were the maximum reaction rate, Vm, and the Michaelis constant, Km. A comparison of these parameters indicated that GO inhibited the catalytic activity of the AChE because of the presence of the AChE–GO complex. The formation of this complex was confirmed with the use of fluorescence data, which was resolved with the use of the MCR-ALS chemometrics method. Furthermore, it was found that the resonance light-scattering (RLS) intensity of AChE changed in the presence of GO. On this basis, it was demonstrated that the relationship between AChE and GO was linear and such models were used for quantitative analyses of GO. Copyright © 2015 John Wiley & Sons, Ltd.
Co-reporter:Zhuo Li, Yong Wang, Yongnian Ni, Serge Kokot
Biosensors and Bioelectronics 2015 70() pp: 246-253
Publication Date(Web):
DOI:10.1016/j.bios.2015.03.035
Co-reporter:Zhuo Li, Yongnian Ni, Serge Kokot
Biosensors and Bioelectronics 2015 Volume 74() pp:91-97
Publication Date(Web):15 December 2015
DOI:10.1016/j.bios.2015.06.014
•A fluorescent nitrogen-doped carbon dots (NCDs) was prepared and characterized.•A sensor was constructed by the combination of FAM-ssDNA and the as-prepared NCDs.•Rapid and simultaneous analysis of 6-mercaptopurine (6-MP) and Hg2+ by the sensor.•The mechanism of the sensor for the analysis of 6-MP and Hg2+ was studied.•The sensor for 6-MP in human serum and Hg2+ in water samples acquired well results.A simple, environmentally friendly hydrothermal method was used to prepare strongly luminescent, nitrogen-doped carbon dots (NCDs) with the use of Chinese yams as a source of carbon and nitrogen. Such NCDs have an average size of 2.7±1.4 nm; they emit blue light at 420 nm and have a quantum yield of up to 9.3%. Thus, carboxyfluorescein (FAM)-DNA macro-molecules were assembled on the surfaces of the NCDs, and stabilised by strong π–π stacking; the so formed hybrid nano-sensors were found to have an ultra-sensitive response to 6-mercaptopurine (6-MP). A strong emission and enhancement of yellow radiation was observed from FAM. Furthermore, due to the specific interactions between DNA and Hg2+, which resulted in the formation of the T–Hg2+–T (T: thymine base) complex – a large, conjugated system, which formed between NCDs, DNA and 6-MP, was broken up. Thus, the fluorescence from FAM was quenched. The detection limits for 6-MP and Hg2+ were 0.67 and 1.26 nM, respectively. The proposed method was applied for the determination of 6-MP in human serum and Hg2+ in water samples with satisfactory results.
Co-reporter:Haiyan Song, Yongnian Ni, Serge Kokot
Colloids and Surfaces A: Physicochemical and Engineering Aspects 2015 Volume 465() pp:153-158
Publication Date(Web):20 January 2015
DOI:10.1016/j.colsurfa.2014.10.047
•A electrochemical sensor based on nano-particles, Cu@CuO/GCE, was constructed.•The catalytic performance of the sensor was studied with the use of DPV technique.•This sensor showed good electrocatalytic activity for the analysis of H2O2.A novel electrochemical sensor was constructed by depositing copper/copper oxide nano-particles on a glassy carbon electrode (GCE) to produce a Cu@CuO/GCE. The morphology and composition of this modified electrode were characterized with the use of scanning electron microscopy (SEM), energy dispersive X-ray spectroscopy (EDS), and X-ray diffraction (XRD) techniques. The electrochemical properties of the novel modified GCE electrode were studied using various electrochemical techniques such as cyclic voltammetry (CV) and electrochemical impedance spectroscopy (EIS). The catalytic performance of the sensor was studied with the use of differential pulse voltammetry (DPV) under optimized conditions. The constructed Cu@CuO/GCE sensor showed significantly better electrocatalytic activity for the analysis of the H2O2 in comparison to the Cu/GCE or GCE. The novel sensor produced a linear response for H2O2 analysis in the range of 0.005–8 mM and the detection limit was 0.23 μM (S/N = 3). Satisfactory results were obtained for H2O2 analyses of tap and lake waters. This performance compares very favorably with the results from several other commonly used techniques for analysis of H2O2.
Co-reporter:Yong Wang and Yongnian Ni
Analytical Chemistry 2014 Volume 86(Issue 15) pp:7463
Publication Date(Web):July 7, 2014
DOI:10.1021/ac5012014
Transition metal chalcogenides, especially molybdenum disulfide (MoS2), have recently attracted wide attention from researchers as graphene-analogous materials. However, until now, little literature has reported the synthesis of photoluminescent MoS2 materials and their applications in analytical chemistry. We herein presented a facile bottom-up hydrothermal route for the synthesis of photoluminescent MoS2 quantum dots (QDs) by using sodium molybdate and cysteine as precursors. The prepared MoS2 QDs were characterized by transmission electron microscopy, atomic force microscopy, X-ray photoelectron spectroscopy, Fourier transform infrared spectroscopy, photoluminescence spectroscopy, and UV–vis spectroscopy. The MoS2 QDs were then used as photoluminescent probes to construct a photoluminescence (PL) quenching sensor for detection of 2,4,6-trinitrophenol (TNP). The TNP sensor presented a wide linear range from 0.099 to 36.5 μM with a high detection limit of 95 nM. Furthermore, the sensor displayed a high sensitivity toward TNP over other structurally similar compounds like 2,4,6-trinitrotoluene, p-chlorophenol, phenol, and 2,6-di-tert-butyl-4-methylphenol. To understand the origin of the high sensitivity, we assessed the emission wavelength-dependent PL quenching behavior of MoS2 QDs by the above five compounds using Stem–Volmer equation in detail. The results showed that the novel approach we put forward can satisfactorily explain the interaction mechanisms between MoS2 QDs and the five compounds, and the high sensitivity for TNP very likely originated from a combination of the PL resonance energy transfer, electronic energy transfer, and electrostatic interactions between MoS2 QDs and TNP. Finally, the sensor was successfully applied for detection of TNP in water samples and test papers.
Co-reporter:Yongnian Ni, Pingping Wang, Haiyan Song, Xiaoyun Lin, Serge Kokot
Analytica Chimica Acta 2014 Volume 821() pp:34-40
Publication Date(Web):22 April 2014
DOI:10.1016/j.aca.2014.03.006
•Construction of a novel DNA/hemin/nafion-graphene/GCE biosensor.•DNA damage induced by the benzo(a)pyrene metabolite was detected.•DPV analysis of benzo(a)pyrene provided a quantitative estimate of DNA damage.•Hemin/H2O2 system could mimic the cytochrome P450 to metabolize benzo(a)pyrene.A novel electrochemical biosensor, DNA/hemin/nafion–graphene/GCE, was constructed for the analysis of the benzo(a)pyrene PAH, which can produce DNA damage induced by a benzo(a)pyrene (BaP) enzyme-catalytic product. This biosensor was assembled layer-by-layer, and was characterized with the use of cyclic voltammetry, electrochemical impedance spectroscopy (EIS) and atomic force microscopy. Ultimately, it was demonstrated that the hemin/nafion–graphene/GCE was a viable platform for the immobilization of DNA. This DNA biosensor was treated separately in benzo(a)pyrene, hydrogen peroxide (H2O2) and in their mixture, respectively, and differential pulse voltammetry (DPV) analysis showed that an oxidation peak was apparent after the electrode was immersed in H2O2. Such experiments indicated that in the presence of H2O2, hemin could mimic cytochrome P450 to metabolize benzo(a)pyrene, and a voltammogram of its metabolite was recorded. The DNA damage induced by this metabolite was also detected by electrochemical impedance and ultraviolet spectroscopy. Finally, a novel, indirect DPV analytical method for BaP in aqueous solution was developed based on the linear metabolite versus BaP concentration plot; this method provided a new, indirect, quantitative estimate of DNA damage.A novel electrochemical biosensor, DNA/hemin/nafion–graphene/GCE, was constructed to quantitatively study the DNA damage induced by the metabolite of benzo(a)pyrene in the presence of H2O2.
Co-reporter:Xiaoyun Lin, Yongnian Ni, Serge Kokot
Electrochimica Acta 2014 Volume 133() pp:484-491
Publication Date(Web):1 July 2014
DOI:10.1016/j.electacta.2014.04.065
•One-step construction of the Cu@AuNPs/GCE electrode.•The modified electrode showed high sensitivity for the analysis of eugenol.•Electrochemical mechanism of eugenol by use of Cu@AuNPs/GCE was inferred.•The novel method was successfully employed for analysis of eugenol in food samples.A simple one-step electrodeposition method was used to construct a glassy carbon electrode (GCE), which has been modified with Cu doped gold nanoparticles (GNPs), i.e. a Cu@AuNPs/GCE. This electrode was characterized with the use of scanning electron microscopy (SEM) and X-ray diffraction (XRD) techniques. The eugenol was electrocatalytically oxidized at the Cu@AuNPs/GCE. At this electrode, in comparison with the behavior at the GCE alone, the corresponding oxidation peak current was enhanced and the shift of the oxidation potentials to lower values was observed. Electrochemical behavior of eugenol at the Cu@AuNPs/GCE was investigated with the use of the cyclic voltammetry (CV) technique, and additionally, in order to confirm the electrochemical reaction mechanism for o-methoxy phenols, CVs for catechol, guaiacol and vanillin were investigated consecutively. Based on this work, an electrochemical reaction mechanism for o-methoxy phenols was suggested, and in addition, the above Cu@AuNPs/GCE was successfully employed for the analysis of eugenol in food samples.A simple one-step electrodeposition method was used to fabricate a Cu doped gold nanoparticles modified glassy carbon electrode. An electrochemical reaction mechanism for o-methoxy phenols was suggested. In addition, the above Cu@AuNPs/GCE was successfully employed for the analysis of eugenol in food samples.
Co-reporter:Yong Wang and Yongnian Ni
Analyst 2014 vol. 139(Issue 2) pp:416-424
Publication Date(Web):29 Oct 2013
DOI:10.1039/C3AN01818K
In recent years, great efforts have focused on the exploration and fabrication of protein nanoconjugates due to potential applications in many fields including bioanalytical science, biosensors, biocatalysis, biofuel cells and bio-based nanodevices. An important aspect of our understanding of protein nanoconjugates is to quantitatively understand how proteins interact with nanomaterials. In this report, human serum albumin (HSA) and citrate-coated silver nanoparticles (AgNPs) are selected as a case study of protein–nanomaterial interactions. UV-visible spectroscopy together with multivariate curve resolution by alternating least squares (MCR-ALS) algorithm is first exploited for the detailed study of AgNPs–HSA interactions. Introduction of the chemometrics tool allows extracting the kinetic profiles, spectra and distribution diagrams of two major absorbing pure species (AgNPs and AgNPs–HSA conjugate). These resolved profiles are then analysed to give the thermodynamic, kinetic and structural information of HSA binding to AgNPs. Transmission electron microscopy, circular dichroism spectroscopy and Fourier transform infrared spectroscopy are used to further characterize the complex system. Moreover, a sensitive spectroscopic biosensor for HSA is fabricated with the MCR-ALS resolved concentration of absorbing pure species. It is found that the linear range for the HSA nanosensor was from 1.9 nM to 45.0 nM with a detection limit of 0.9 nM. It is believed that the proposed method will play an important role in the fabrication and optimization of a robust nanobiosensor or cross-reactive sensors array for the detection and identification of biocomponents.
Co-reporter:Zhuo Li, Ruiling Sun, Yongnian Ni and Serge Kokot
Analytical Methods 2014 vol. 6(Issue 18) pp:7420-7425
Publication Date(Web):08 Jul 2014
DOI:10.1039/C4AY01222D
An efficient method for the analysis of hydroquinone at trace levels in water samples has been developed in the form of a fluorescent probe based on graphene quantum dots (GQDs). The analytical variable, fluorescence quenching, was generated from the formation of benzoquinone intermediates, which formed during the catalytic oxidation of hydroquinone by horseradish peroxidase (HRP). In general, the reaction mechanism involved hydroquinone, as an electron acceptor, which affected the surface state of GQDs via an electron transfer effect. The water-soluble GQDs were directly prepared by the pyrolysis of citric acid and with the use of the mentioned hybrid enzyme system, the detection limit for hydroquinone was as low as 8.4 × 10⁻⁸ M. Furthermore, this analysis was almost unaffected by other phenol and quinine compounds, such as phenol, resorcinol and other quinines, and therefore, the developed GQD method produced satisfactory results for the analysis of hydroquinone in several different lake water samples.
Co-reporter:Hua Zhuang, Yongnian Ni, Serge Kokot
Chemometrics and Intelligent Laboratory Systems 2014 Volume 135() pp:183-191
Publication Date(Web):15 July 2014
DOI:10.1016/j.chemolab.2014.04.018
•Courtan moutan (CM) root samples were analyzed by both HPLC–DAD and ICP-MS techniques.•Geographical classification of CM samples with the aid of chemometrics•Classification and pattern recognition of CM samples based on individual and combined data•Relationship between the organic and trace metallic analytes was identified by MLR.A combined data matrix consisting of high performance liquid chromatography–diode array detector (HPLC–DAD) and inductively coupled plasma-mass spectrometry (ICP-MS) measurements of samples from the plant roots of the Cortex moutan (CM), produced much better classification and prediction results in comparison with those obtained from either of the individual data sets. The HPLC peaks (organic components) of the CM samples, and the ICP-MS measurements (trace metal elements) were investigated with the use of principal component analysis (PCA) and the linear discriminant analysis (LDA) methods of data analysis; essentially, qualitative results suggested that discrimination of the CM samples from three different provinces was possible with the combined matrix producing best results. Another three methods, K-nearest neighbor (KNN), back-propagation artificial neural network (BP-ANN) and least squares support vector machines (LS-SVM) were applied for the classification and prediction of the samples. Again, the combined data matrix analyzed by the KNN method produced best results (100% correct; prediction set data). Additionally, multiple linear regression (MLR) was utilized to explore any relationship between the organic constituents and the metal elements of the CM samples; the extracted linear regression equations showed that the essential metals as well as some metallic pollutants were related to the organic compounds on the basis of their concentrations.
Co-reporter:Ruiling Sun, Yong Wang, Yongnian Ni, Serge Kokot
Spectrochimica Acta Part A: Molecular and Biomolecular Spectroscopy 2014 Volume 122() pp:529-535
Publication Date(Web):25 March 2014
DOI:10.1016/j.saa.2013.11.071
•Quantifying three anti-carcinogenic flavonoids, catechin, quercetin and naringenin.•Yellow product was obtained from reduction of Cu(II) to Cu(I) by the flavonoids.•Chemometrics was used to process overlapped kinetic spectra.•Simultaneous assay of three anti-carcinogenic flavonoids in fruit samples.A simple, inexpensive and sensitive kinetic spectrophotometric method was developed for the simultaneous determination of three anti-carcinogenic flavonoids: catechin, quercetin and naringenin, in fruit samples. A yellow chelate product was produced in the presence neocuproine and Cu(I) – a reduction product of the reaction between the flavonoids with Cu(II), and this enabled the quantitative measurements with UV–vis spectrophotometry. The overlapping spectra obtained, were resolved with chemometrics calibration models, and the best performing method was the fast independent component analysis (fast-ICA/PCR (Principal component regression)); the limits of detection were 0.075, 0.057 and 0.063 mg L−1 for catechin, quercetin and naringenin, respectively. The novel method was found to outperform significantly the common HPLC procedure.Graphical abstract
Co-reporter:Haiyan Song, Yongnian Ni, Serge Kokot
Biosensors and Bioelectronics 2014 Volume 56() pp:137-143
Publication Date(Web):15 June 2014
DOI:10.1016/j.bios.2014.01.014
•Synthesis of a new layered material: MoS2–graphene.•Horseradish peroxidase is used to build a novel hybrid biomaterial: HRP–MoS2–graphene.•Construction of a novel HRP–MoS2–graphene/GCE biosensor.•The biosensor shows excellent electrocatalytic activity towards hydrogen peroxide.•High sensitivity and low detection limit were obtained for the biosensor.The self-assembly of layered molybdenum disulfide–graphene (MoS2–Gr) and horseradish peroxidase (HRP) by electrostatic attraction into a novel hybrid nanomaterial (HRP–MoS2–Gr) is reported. The properties of the MoS2–Gr were characterized by X-ray diffraction (XRD), high-resolution transmission electron microscopy (TEM), electrochemical impedance spectroscopy (EIS) and cyclic voltammetry (CV). UV–vis and Fourier transform infrared spectroscopy (FT-IR) indicate that the native structure of the HRP is maintained after the assembly, implying good biocompatibility of MoS2–Gr nanocomposite. Furthermore, the HRP–MoS2–Gr composite is utilized as a biosensor, which displays electrocatalytic activity to hydrogen peroxide (H2O2) with high sensitivity (679.7 μA mM−1 cm−2), wide linear range (0.2 μM–1.103 mM), low detection limit (0.049 μM), and fast amperometric response. In addition, the biosensor also exhibits strong anti-interference ability, satisfactory stability and reproducibility. These desirable electrochemical properties are attributed to the good biocompatibility and electron transport efficiency of the MoS2–Gr composite, as well as the high loading of HRP. Therefore, this biosensor is potentially suitable for H2O2 analysis in environmental, pharmaceutical, food or industrial applications.
Co-reporter:Yong Wang, Minghua Mei, Yongnian Ni, Serge Kokot
Spectrochimica Acta Part A: Molecular and Biomolecular Spectroscopy 2014 130() pp: 539-545
Publication Date(Web):
DOI:10.1016/j.saa.2014.04.062
Co-reporter:Zhuo Li, Yong Wang, Yongnian Ni, Serge Kokot
Sensors and Actuators B: Chemical 2014 193() pp: 205-211
Publication Date(Web):
DOI:10.1016/j.snb.2013.11.096
Co-reporter:Ruiling Sun, Yong Wang, Yongnian Ni, Serge Kokot
Talanta 2014 Volume 125() pp:341-346
Publication Date(Web):1 July 2014
DOI:10.1016/j.talanta.2014.03.007
•Graphene quantum dots (GQDs) as an effective sensor for trace phenol detecting.•Resonance light scattering (RLS) was applied for environmental analysis.•High selective and sensitive method for phenol analysis was developed.A novel, highly selective resonance light scattering (RLS) method was researched and developed for the analysis of phenol in different types of industrial water. An important aspect of the method involved the use of graphene quantum dots (GQDs), which were initially obtained from the pyrolysis of citric acid dissolved in aqueous solutions. The GQDs in the presence of horseradish peroxidase (HRP) and H2O2 were found to react quantitatively with phenol such that the RLS spectral band (310 nm) was quantitatively enhanced as a consequence of the interaction between the GQDs and the quinone formed in the above reaction. It was demonstrated that the novel analytical method had better selectivity and sensitivity for the determination of phenol in water as compared to other analytical methods found in the literature. Thus, trace amounts of phenol were detected over the linear ranges of 6.00×10⁻⁸–2.16×10⁻⁶ M and 2.40×10⁻⁶–2.88×10⁻⁵ M with a detection limit of 2.20×10⁻⁸ M. In addition, three different spiked waste water samples and two untreated lake water samples were analysed for phenol. Satisfactory results were obtained with the use of the novel, sensitive and rapid RLS method.A high selective and sensitive method for trace detection of phenol in waste water samples was developed by using the resonance light scattering (RLS) technique. The method involves the use of graphene quantum dots (GQDs) and the phenol was catalyzed by horseradish peroxidase (HRP) and H2O2 to produce an intermediate of quinone, which was combined with GQDs to enhance the RLS intensity.
Co-reporter:Yong Wang, Yongnian Ni
Talanta 2014 Volume 119() pp:320-330
Publication Date(Web):15 February 2014
DOI:10.1016/j.talanta.2013.11.026
•Study of evolution of protein nanoconjugate with UV–vis spectroscopy and chemometrics.•Quantitative extraction of distribution diagrams, spectra and kinetic profiles.•MCR-ALS concentration evolution enables a sensitive spectroscopic biosensor for HSA.Study of the interactions between proteins and nanomaterials is of great importance for understanding of protein nanoconjugate. In this work, we choose human serum albumin (HSA) and citrate-capped gold nanoparticles (AuNPs) as a model of protein and nanomaterial, and combine UV–vis spectroscopy with multivariate curve resolution by an alternating least squares (MCR-ALS) algorithm to present a new and efficient method for comparatively comprehensive study of evolution of protein nanoconjugate. UV–vis spectroscopy coupled with MCR-ALS allows qualitative and quantitative extraction of the distribution diagrams, spectra and kinetic profiles of absorbing pure species (AuNPs and AuNPs–HSA conjugate are herein identified) and undetectable species (HSA) from spectral data. The response profiles recovered are converted into the desired thermodynamic, kinetic and structural parameters describing the protein nanoconjugate evolution. Analysis of these parameters for the system gives evidence that HSA molecules are very likely to be attached to AuNPs surface predominantly as a flat monolayer to form a stable AuNPs–HSA conjugate with a core–shell structure, and the binding process takes place mainly through electrostatic and hydrogen-bond interactions between the positively amino acid residues of HSA and the negatively carboxyl group of citrate on AuNPs surface. The results obtained are verified by transmission electron microscopy, zeta potential, circular dichroism spectroscopy and Fourier transform infrared spectroscopy, showing the potential of UV–vis spectroscopy for study of evolution of protein nanoconjugate. In parallel, concentration evolutions of pure species resolved by MCR-ALS are used to construct a sensitive spectroscopic biosensor for HSA with a linear range from 1.8 nM to 28.1 nM and a detection limit of 0.8 nM.
Co-reporter:Yong Wang, Ruirui Zhu, Yongnian Ni, Serge Kokot
Spectrochimica Acta Part A: Molecular and Biomolecular Spectroscopy 2014 Volume 123() pp:241-248
Publication Date(Web):5 April 2014
DOI:10.1016/j.saa.2013.12.063
•Fluorescence and UV–vis data matrices were combined.•Four data matrices related to the interaction of the BDM with BSA were analysed.•Chemometrics were used to interpret the interaction of the BDM and DXM with BSA.•DXM competed with the BDM molecules bound in the BDM–BSA complex.•Two multi-way calibration approaches, MCR–ALS and PARAFAC, were used.Interactions between the anti-carcinogens, bendamustine (BDM) and dexamethasone (DXM), with bovine serum albumin (BSA) were investigated with the use of fluorescence and UV–vis spectroscopies under pseudo-physiological conditions (Tris–HCl buffer, pH 7.4). The static mechanism was responsible for the fluorescence quenching during the interactions; the binding formation constant of the BSA–BDM complex and the binding number were 5.14 × 10⁵ L mol−1 and 1.0, respectively. Spectroscopic studies for the formation of BDM–BSA complex were interpreted with the use of multivariate curve resolution – alternating least squares (MCR–ALS), which supported the complex formation. The BSA samples treated with site markers (warfarin – site I and ibuprofen – site II) were reacted separately with BDM and DXM; while both anti-carcinogens bound to site I, the binding constants suggested that DXM formed a more stable complex. Relative concentration profiles and the fluorescence spectra associated with BDM, DXM and BSA, were recovered simultaneously from the full fluorescence excitation–emission data with the use of the parallel factor analysis (PARAFAC) method. The results confirmed that on addition of DXM to the BDM–BSA complex, the BDM was replaced and the DXM–BSA complex formed; free BDM was released. This finding may have consequences for the transport of these drugs during any anti-cancer treatment.Graphical abstractInteraction between anti-carcinogens, bendamustine (BDM) and dexamethasone (DXM), with BSA was investigated under pseudo-physiological conditions (pH 7.4; fluorescence and UV–vis spectroscopies). DMX replaced the bound BDM in the BDM–BSA complex.
Co-reporter:Haiyan Song, Yongnian Ni, Serge Kokot
Analytica Chimica Acta 2013 Volume 788() pp:24-31
Publication Date(Web):25 July 2013
DOI:10.1016/j.aca.2013.06.016
•Synthesis of a new biological material-hemin-graphene.•Construction of a novel hemin-graphene/gold nanoparticles biosensor.•The biosensor showed excellent electrocatalytic activity toward hydrogen peroxide.•The process of constructing the biosensor is easy and quick.•The biosensor has a high sensitivity and low detection limit.Hydrogen peroxide is an important analyte in biochemical, industrial and environmental systems. Therefore, development of novel rapid and sensitive analytical methods is useful. In this work, a hemin-graphene nano-sheets (H-GNs)/gold nano-particles (AuNPs) electrochemical biosensor for the detection of hydrogen peroxide (H2O2) was researched and developed; it was constructed by consecutive, selective modification of the GCE electrode. Performance of the H-GNs/AuNPs/GCE was investigated by chronoamperometry, and AFM measurements suggested that the graphene flakes thickness was ∼1.3 nm and that of H-GNs was ∼1.8 nm, which ultimately indicated that each hemin layer was ∼0.25 nm. This biosensor exhibited significantly better electrocatalytic activity for the reduction of hydrogen peroxide in comparison with the simpler AuNPs/GCE and H-GNs/GCE; it also displayed a linear response for the reduction of H2O2 in the range of 0.3 μM to 1.8 mM with a detection limit of 0.11 μM (S N−1 = 3), high sensitivity of 2774.8 μA mM−1 cm−2, and a rapid response, which reached 95% of the steady state condition within 5 s. In addition, the biosensor was unaffected by many interfering substances, and was stable over time. Thus, it was demonstrated that this biosensor was potentially suitable for H2O2 analysis in many types of sample.A novel hemin-graphene nano-sheets (H-GNs)/gold nano-particles (AuNPs) electrochemical biosensor was constructed for analysis of hydrogen peroxide. Due to the synergy effect of H-GNs and AuNPs, the biosensor showed a satisfactory electrocatalytic activity for the reduction of hydrogen peroxide.
Co-reporter:Xiaoyun Lin, Yongnian Ni, Serge Kokot
Analytica Chimica Acta 2013 Volume 765() pp:54-62
Publication Date(Web):26 February 2013
DOI:10.1016/j.aca.2012.12.036
Electrochemical behavior of three antioxidants: butylated hydroxyanisole (BHA), butylated hydroxytoluene (BHT) and butylated hydroquinone (TBHQ), was investigated at a glassy carbon electrode modified with gold nanoparticles (AuNPs/GCE). This electrode was characterized by scanning electron microscopy (SEM). The experimental results indicated that the modified electrode was strongly electroactive during the redox reactions of BHA, BHT and TBHQ, and this was confirmed by the observed increased redox peak currents and shifted potentials; in addition, the oxidation products of BHA and TBHQ were found to be the same. The experimental conditions were optimized and the oxidation peaks of BHA and BHT were clearly separated. Based on this, an electrochemical method was researched and developed for the simultaneous determination of BHA, BHT and TBHQ in mixtures with the use of first derivative voltammetry; the linear concentration ranges were 0.10–1.50 μg mL−1, 0.20–2.20 μg mL−1 and 0.20–2.80 μg mL−1, and detection limits were 0.039, 0.080 and 0.079 μg mL−1, for BHA, BHT and TBHQ, respectively. The proposed method was successfully applied for the analysis of the three analytes in edible oil samples.Graphical abstractHighlights► A gold nanoparticles modified glassy carbon electrode (AuNPs/GCE) was constructed. ► The electrochemical mechanism of BHA, BHT and TBHQ at the AuNPs/GCE was studied. ► The oxidation products of BHA and TBHQ were found to be the same. ► First-derivative method was used to resolve the overlapped voltammograms. ► Synthetic antioxidants in food samples were analyzed.
Co-reporter:Yongnian Ni, Fangyuan Zhang, Serge Kokot
Analytica Chimica Acta 2013 Volume 769() pp:40-48
Publication Date(Web):26 March 2013
DOI:10.1016/j.aca.2013.01.038
The interaction of graphene oxide (GO), a medicinal drug (10-hydroxy camptothecin (HCPT)), and bovine serum albumin (BSA) was investigated with the aim of developing a method for the analysis of serum albumin proteins. It was demonstrated that HCPT could be readily loaded onto GO via the π–π stacking interaction, and the delivery of HCPT to BSA was improved in the presence of GO; this, in turn, facilitated the binding interaction of HCPT and BSA. Chemometrics methods, multivariate curve resolution-alternating least squares (MCR-ALS) and parallel factor analysis (PARAFAC), were applied to resolve spectral data, and this assisted in the elucidation of the above interaction. GO was found to enhance the fluorescence response of HCPT to BSA, and thus, a low cost fluorescence bio-sensing platform was developed for fluorescence-enhanced detection of BSA based on GO. The satisfactory analytical performance of this biosensor for BSA was attributed to the structure and electronic properties of GO.Graphical abstractHighlights► Studied the loading interaction of HCPT (10-hydroxy camptothecin) on graphene oxide. ► The nature of the interaction between graphene oxide, HCPT and BSA was investigated. ► Studied the HCPT–GO–BSA system with three-way fluorescence spectroscopy and chemometrics. ► A novel BSA biosensor was constructed with improved sensitivity and selectivity.
Co-reporter:Wenjiang Dong, Yongnian Ni, and Serge Kokot
Journal of Agricultural and Food Chemistry 2013 Volume 61(Issue 3) pp:540-546
Publication Date(Web):December 24, 2012
DOI:10.1021/jf305272s
Near-infrared spectroscopy (NIRS) calibrations were developed for the discrimination of Chinese hawthorn (Crataegus pinnatifida Bge. var. major) fruit from three geographical regions as well as for the estimation of the total sugar, total acid, total phenolic content, and total antioxidant activity. Principal component analysis (PCA) was used for the discrimination of the fruit on the basis of their geographical origin. Three pattern recognition methods, linear discriminant analysis, partial least-squares-discriminant analysis, and back-propagation artificial neural networks, were applied to classify and compare these samples. Furthermore, three multivariate calibration models based on the first derivative NIR spectroscopy, partial least-squares regression, back-propagation artificial neural networks, and least-squares-support vector machines, were constructed for quantitative analysis of the four analytes, total sugar, total acid, total phenolic content, and total antioxidant activity, and validated by prediction data sets.
Co-reporter:Qiulan Zhang, Yongnian Ni, and Serge Kokot
Journal of Agricultural and Food Chemistry 2013 Volume 61(Issue 32) pp:7730-7738
Publication Date(Web):July 22, 2013
DOI:10.1021/jf402316j
The effect of ionic surfactants, sodium dodecyl sulfate (SDS) and N-cetyl-N,N,N-trimethylammonium bromide (CTAB), on the interaction between β-agonist salbutamol (SAL) and bovine serum albumin (BSA) was investigated with the use of fluorescence spectroscopy (FLS) and chemometrics methods [multivariate curve resolution-alternating least-squares (MCR-ALS) and parallel factor analysis algorithm (PARAFAC)]. It was found that the binding constant of SAL to BSA in the presence of CTAB was much larger than that without this ligand. The ligand/BSA stoichiometry was 4:1, that is, (CTAB)4–BSA, and was 2:1 with the ligand, that is, (SAL)2–BSA. These results were obtained from the concentration profiles extracted by MCR-ALS for all three reactants. Quantitative information on the complex CTAB–BSA–SAL species was obtained with the resolution of the excitation–emission fluorescence three-way data matrices by PARAFAC. This research has implications for the analysis of SAL in food and might be performed in laboratories associated with organizations such as the U.S. Food and Drug Administration (FDA) and the International Olympic Committee (IOC).
Co-reporter:Yong Wang, Baohui Li, Yongnian Ni and Serge Kokot
Analytical Methods 2013 vol. 5(Issue 21) pp:6051-6057
Publication Date(Web):29 Aug 2013
DOI:10.1039/C3AY40985F
Standard chemical methods of analysis for marker alkaloids and flavonoids such as rutin, apigenin, quercetin, kaempferol, and leonurine were insufficient to discriminate the geographical origins of the complex Herba leonuri (HL) samples. This led to the research and development of a novel, quantitative HPLC fingerprint method for the simultaneous analysis of the content of important markers present in the HL samples. Seven HPLC peaks were selected and a structure was assigned to five. Fifty-six HL samples collected from three provinces, Anhui, Hubei, and Jiangxi, were analyzed by the above HPLC method and the resulting 56 × 7 matrix of the HPLC fingerprints and the seven marker compounds was submitted to principal component analysis (PCA) with consequent discrimination of the HL samples according to their geographical origins; interestingly, it was found that the highly correlated L6 (kaempferol) and L7 (apigenin) loadings were independent of the other five marker compound loadings (L1–L5). In addition, the L6 and L7 variables were related only to the Jiangxi group, while the L1–L5 loadings were associated with Jiangxi and Anhui; the Hubei cluster was not directly related to any loading. For quantitative analysis, the least squares-support vector machine (LS-SVM) calibration model was able to predict 94.4% of the samples correctly.
Co-reporter:Ping Qiu, Yong-Nian Ni, Serge Kokot
Chinese Chemical Letters 2013 Volume 24(Issue 3) pp:246-248
Publication Date(Web):March 2013
DOI:10.1016/j.cclet.2013.01.029
In this work, artificial neural network (ANN), a powerful chemometrics approach for linear and non-linear calibration models, was applied to detect three pesticides in mixtures by linear sweep stripping voltammetry (LSSV) despite their overlapped voltammograms. Electrochemical parameters for the voltammetry, such as scan rate, deposit time and deposit potential, were evaluated and optimized from the signal response data using ANN model by minimizing the relative prediction error (RPE). The proposed method was successfully applied to the detection of pesticides in synthetic samples and several commercial fruit samples.Artificial neural network, a chemometric approach, was applied to determine three pesticides in mixtures by linear sweep stripping voltammetry.
Co-reporter:Haiyan Song;Yongnian Ni;Serge Kokot
Microchimica Acta 2013 Volume 180( Issue 13-14) pp:1263-1270
Publication Date(Web):2013 October
DOI:10.1007/s00604-013-1053-0
We report on a modified glassy carbon electrode (GCE) for sensing hydrogen peroxide (H2O2). It was constructed by consecutive electrochemical deposition of poly(anthranilic acid) and poly(diphenylamine sulfonate) on the GCE, followed by the deposition of copper oxide (CuO). The morphology and electrochemistry of the modified electrode was characterized by atomic force microscopy, X-ray diffraction, cyclic voltammetry, and electrochemical impedance spectroscopy. The catalytic performance of the sensor was studied with the use of differential pulse voltammetry under optimized conditions. This sensor displayed significantly better electrocatalytic activity for the reduction of H2O2 in comparison to a GCE without or with modification with CuO or polymer films alone. The response to H2O2 is linear in the range between 0.005 to ~11 mM, and the detection limit is 0.18 μM (at an S/N of 3).
Co-reporter:Yongnian Ni, Minghua Mei, Serge Kokot
Analytica Chimica Acta 2012 Volume 712() pp:37-44
Publication Date(Web):27 January 2012
DOI:10.1016/j.aca.2011.11.010
Many complex natural or synthetic products are analysed either by the GC–MS (gas chromatography–mass spectrometry) or HPLC–DAD (high performance liquid chromatography–diode-array detector) technique, each of which produces a one-dimensional fingerprint for a given sample. This may be used for classification of different batches of a product. GC–MS and HPLC–DAD analyses of complex, similar substances represented by the three common types of the TCM (traditional Chinese medicine), Rhizoma Curcumae were analysed in the form of one- and two-dimensional matrices firstly with the use of PCA (Principal component analysis), which showed a reasonable separation of the samples for each technique. However, the separation patterns were rather different for each analytical method, and PCA of the combined data matrix showed improved discrimination of the three types of object; close associations between the GC–MS and HPLC–DAD variables were observed. LDA (linear discriminant analysis), BP-ANN (back propagation-artificial neural networks) and LS-SVM (least squares-support vector machine) chemometrics methods were then applied to classify the training and prediction sets. For one-dimensional matrices, all training models indicated that several samples would be misclassified; the same was observed for each prediction set. However, by comparison, in the analysis of the combined matrix, all models gave 100% classification with the training set, and the LS-SVM calibration also produced a 100% result for prediction, with the BP-ANN calibration closely behind. This has important implications for comparing complex substances such as the TCMs because clearly the one-dimensional data matrices alone produce inferior results for training and prediction as compared to the combined data matrix models. Thus, product samples may be misclassified with the use of the one-dimensional data because of insufficient information.Graphical abstractHighlights► GC–MS and HPLC–DAD technique were combined to produce two-way fingerprints for the complex materials. ► Supervised chemometrics methods, LDA, BP-ANN and LS-SVM were used for classification. ► Improved information and discrimination of the objects were obtained from the combined data matrix models.
Co-reporter:Xiaoyun Lin, Yongnian Ni, Shuzhen Li and Serge Kokot
Analyst 2012 vol. 137(Issue 9) pp:2086-2094
Publication Date(Web):14 Mar 2012
DOI:10.1039/C2AN16062E
An electrochemical method involving a gold nanoparticle modified glassy carbon electrode (AuNPs/GCE) was researched and developed for the simultaneous analysis of three β2-agonists, ractopamine (RAC), salbutamol (SAL) and clenbuterol (CLB). The three analytes were electrocatalytically oxidized at the AuNP/GCE, which enhanced the oxidation peak current and influenced the shift of the oxidation potentials to lower values in comparison with the analysis involving only the GCE. The differential pulse stripping voltammetry (DPSV) voltammograms from the drug mixture produced complex, overlapping profiles, and chemometrics methods were applied for calibration modeling. The peak currents associated with RAC, SAL and CLB measurements were linear as a function of their concentrations (ranges within 0.005–0.150 μg mL−1); the detection limits for RAC, SAL and CLB were 2.4, 5.8 and 2.6 ng mL−1, respectively. It was shown that satisfactory quantitative results were obtained with the use of the MVC1 package of chemometrics methods e.g. the PLS1 calibration model produced a relative prediction error (RPET) of 7.0% and an average recovery of 97.6%. The above AuNP/GCE was successfully employed for the simultaneous analysis of RAC, SAL and CLB in pork meat, liver and pig feed samples.
Co-reporter:Yong Sheng Zhong, Yong Nian Ni, Serge Kokot
Chinese Chemical Letters 2012 Volume 23(Issue 3) pp:339-342
Publication Date(Web):March 2012
DOI:10.1016/j.cclet.2012.01.007
A reliable method for simultaneous determination of three antibiotic drugs (levofloxacin, gatifloxacin and lomefloxacin) by differential pulse stripping voltammetry (DPSV) in Britton–Robinson buffer (pH 7.96) was presented. The method is based on adsorptive accumulation of the antibacterial drugs on a hanging mercury dropping electrode (HMDE), followed by the reduction of the adsorptive species by the technique of DPSV. Optimal conditions, the deposition time of 80 s, the deposition potential of −1250 mV, and the scan rate of 25 mV/s, were obtained. The linear concentration ranges of 0.010–0.080 μg/mL were obtained for all these three antibiotic drugs, while the detection limits were 2.38, 3.20 and 1.60 ng/mL for levofloxacin, gatifloxacin and lomefloxacin, respectively. In this work, chemometrics methods, such as classical least squares (CLS), partial least squares (PLS), principle component regression (PCR) and radial basis function-artificial neural networks (RBF-ANN), were used to quantitatively resolve the overlapping signals. It was found that PCR gave the best results with total relative prediction error (RPET) of 7.71%. The proposed method was applied to determine these three drugs in several commercial food samples with spiked method and yielded satisfactory recoveries.
Co-reporter:Yongnian Ni, Baohui Li and Serge Kokot
Analytical Methods 2012 vol. 4(Issue 12) pp:4326-4333
Publication Date(Web):01 Nov 2012
DOI:10.1039/C2AY25950H
Performance of a novel analytical method for complex samples, based on combined or fused high-performance liquid chromatography (HPLC) and Fourier transform infrared spectroscopy (FT-IR) data, was compared with that based on measurements from either of the techniques. The analytes were different varieties of Radix Paeoniae (Shaoyao), traditional Chinese medicines (TCM), from various regions. When the HPLC and FT-IR datasets (L and R) were separately submitted to either PCA or several supervised classification and prediction methods, the recognition rates were unsatisfactory. Thus, the potential of combined data of these two techniques was investigated, and two statistical methods for reducing the dimensions of the fused data were developed based on: (i) four PCs from the L and R matrices, and (ii) selection of optimum variables by the genetic algorithm-partial least squares (GA-PLS). PCA of these two fused sets indicated improved discrimination of the different sample clusters. Subsequent application of the supervised classification and prediction methods—linear discriminant analysis (LDA), least squares-support vector machine (LS-SVM), and radial basis function neural network (RBF-ANN)—indicated significantly higher recognition rates. Thus, the best discrimination of the complex Shaoyao TCM samples on the basis of their variety and geographical origin, was obtained with the use of non-linear RBF-ANN and LS-SVP models.
Co-reporter:Yongnian Ni, Yao Gu, Serge Kokot
Chemometrics and Intelligent Laboratory Systems 2012 Volume 112() pp:55-64
Publication Date(Web):15 March 2012
DOI:10.1016/j.chemolab.2012.01.001
A spectrofluorimetric analytical method was researched and developed for the quantitative, simultaneous analysis of nitrofurazone and nitrofurantoin antibiotics. The method was based on the kinetic analysis of their hydrolysis reaction coupled with multivariate calibration methods. These consisted of several different multiway data models, and their prediction performance was compared on the basis of the above reaction. Nitrofurans do not fluoresce but their alkaline hydrolysis products show strong fluorescence at 245 nm/456 nm (excitation/emission wavelengths) and 240 nm/452 nm. Different multiway data matrices were acquired at various excitation and/or emission wavelengths, and/or reaction times and resolved by multiway calibration methods, i.e. the parallel factor analysis, unfolded principal component analysis–residual bilinearization and unfolded principal component analysis–residual trilinearization methods. All of these procedures facilitate the second-order advantage. The relationship between the concentration of the analytes and the fluorescence output was found to be nonlinear. Hence, the results from the calibration models were submitted to the radial basis function artificial neural networks for prediction. The best performing prediction model, unfolded principal component analysis–residual bilinearization–radial basis function artificial neural networks, was used to analyze the nitrofurans in fish samples and the results compared well with those obtained from the reference HPLC method.Highlights► Determination of two nitrofurans based on a spectrofluorimetric kinetic method. ► The quadratic polynomial and RBF-ANN were employed to solve the nonlinear system. ► Different calibration methods were acquired for the analysis of multi-way data. ► Fish samples with fluorescent background were analyzed with satisfied results.
Co-reporter:Yongnian Ni, Rongmei Song, Serge Kokot
Spectrochimica Acta Part A: Molecular and Biomolecular Spectroscopy 2012 Volume 96() pp:252-258
Publication Date(Web):October 2012
DOI:10.1016/j.saa.2012.05.031
A novel method for the discrimination of the three kinds of Indigowoad Root sample, Radix Isatidis (RI), Rhizoma et Radix Baphicacanthis Cusia (RRBC) and simulated adulterated samples (AD) was researched and developed with the use of near infrared spectroscopy (NIR) and chemometrics. Principal component analysis (PCA) was applied to process the NIR data of 75 collected Indigowoad Root samples, and the three kinds of such sample were discriminated along the first principal component (PC1) axis. In addition, the data pretreatment methods – genetic algorithm-partial least squares (GA-PLS), successive projections algorithm (SPA), and wavelet transform (WT), were employed to select the key analytical wavelengths, and then, these were used as input variables for the three kinds of the pattern recognition method, such as K-nearest neighbor (KNN), radial basis function-artificial neural network (RBF-ANN), least squares-support vector machine (LS-SVM) and back propagation-artificial neural network (BP-ANN). The WT was the method of choice for data pretreatment, and three pretreatment-prediction method combinations performed well (basis: %recognition rate) – WT-KNN (98.2%) and BP-ANN (97.3%) as well as GA-PLS – LS-SVM (97.2). A BP-ANN calibration model was built for the quantitative discrimination of the three types of the complex Indigowoad Root samples, and it was successfully validated.Graphical abstractNIR spectral and chemometrics methods were used to discriminate the three types of Indigowoad Root samples. It was found that the samples were well separated along the PC1 axis and the pattern recognition models preprocessed by wavelet transform gave much better performance. As part of the quality control, the NIR data of the samples were also used to evaluate the samples’ quantitative composition. Highlights► Discrimination of Radix Isatidis and Rhizoma et Radix Baphicacanthis Cusia. ► Combination of NIR spectroscopy and chemometrics. ► PCA was used to observe the distribution of the 75 Indigowoad Root samples. ► All models preprocessed by WT gave much better performance for classification.
Co-reporter:Qiulan Zhang, Yongnian Ni, Serge Kokot
Talanta 2012 Volume 88() pp:524-532
Publication Date(Web):15 January 2012
DOI:10.1016/j.talanta.2011.11.027
An analytical method was researched for the simultaneous determination of reactants and products during the binding of important small molecules such as levodopa (LD) with biopolymers such as bovine serum albumin (BSA). Voltammetry and fluorescence spectroscopy were used to obtain the analytical profiles from different reactant mixtures as a function of concentration. This enabled the extraction of the equilibrium constants (KSV) which are reported for the first time. Voltammetric results supported the formation of the LD–BSA complex but not that with dopamine. Further information of the LD–BSA system was unattainable because the measured composite profiles could not be extracted.New information was obtained when the extended data matrix was resolved by the MCR–ALS method. The previously unavailable extracted voltammogram profile of LD–BSA complex indicated that the complex was electroactive; this was unexpected if the LD–BSA system was in its folded state, and hence, it was suggested that the protein must be unfolded. The observation that the drug:BSA stoichiometry was 3:1, i.e. (levodopa)3–BSA, supported this suggestion; these results were obtained from the MCR–ALS extracted concentration profiles for the three reaction components.Highlights► Voltammetric and fluorescence data matrices were combined. ► MCR–ALS was applied to resolve the expanded data matrix. ► Levodopamine–BSA complex is likely to be unfolded during the interaction. ► New previously unobtainable information was extracted by chemometrics.
Co-reporter:Wen-Jiang Dong;Yong-Nian Ni;Serge Kokot
Chemical Papers 2012 Volume 66( Issue 12) pp:1083-1091
Publication Date(Web):2012 December
DOI:10.2478/s11696-012-0231-6
Authentication of traditional Chinese medicines (TCMs) has become important because they can be adulterated with relatively cheap herbal medicines similar in appearance. Detection of such adulterated samples is needed because their presence is likely to reduce the pharmacological potency of the original TCM and, in the worst cases, the samples may be harmful. The aim of this study was to develop a rapid near-infrared spectroscopy (NIRS) analytical method which was supported by multi-variate calibration, e.g. partial least squares regression (PLSR) and radial basis function artificial neural networks (RBF-ANN), in order to quantify the TCM and the adulterants. In this work, Cynanchum stauntonii (CS), a commonly used TCM, in mixtures with one or two adulterants — two morphological types of TCM, Cynanchum atrati (CA) and Cynanchum paniculati (CP), were determined using NIR reflectance spectroscopy. The three sample sets, CS adulterated with CA or CP, and CS with both CA and CP, were measured in the range of 800–2500 nm. Both PLSR and RBF-ANN calibration models provided satisfactory results, even at an adulteration level of 5 mass %, but the RBF-ANN models with better root mean square error of prediction (RMSEP) values for CS, CA, and CP arguably performed better. Consequently, this work demonstrates that the NIR method of sampling complex mixtures of similar substances such as CS adulterated by CA and/or CP is capable of producing data suitable for the quantitative analysis of mixtures consisting of the original TCM adulterated by one or two similar substances, provided the spectral data are interrogated by multi-variate methods of data analysis such as PLS or RBF-ANN.
Co-reporter:Yongnian Ni, Pingping Wang, Serge Kokot
Biosensors and Bioelectronics 2012 Volume 38(Issue 1) pp:245-251
Publication Date(Web):October–December 2012
DOI:10.1016/j.bios.2012.05.034
Electrochemical behavior of nitrofurazone (NFZ) was investigated with the use of cyclic voltammetry (CV) and differential pulse voltammetry (DPV) methods. The pH-dependence of NFZ was studied at a glassy carbon electrode (GCE) in ethanol/Britton–Robinson buffer (30:70), and short-lived nitro-radicals were generated by the reduction of NFZ at high pHs (>7.0). In the presence of DNA, the DPV peak current of NFZ decreased and the peak potential shifted negatively, which indicated that there was an electrostatic interaction between NFZ and DNA. An electrochemical dsDNA/GCE biosensor was prepared to study the DNA damage produced in the presence NFZ; this process was followed with the use of the Co(phen)32+ electroactive probe. Also, the oxidation peaks of guanosine (750 mV) and adenosine (980 mV) indicated that DNA damage was related directly to the nitro-radicals. Experiments demonstrated that DNA damage occurred via two different steps while NFZ was metabolized and nitro-radicals were produced. Novel work with AFM on the NFZ/DNA interaction supported the suggestion that in vivo, the nitro-radicals were more cytotoxic than the NFZ molecules. A linear DPV calibration plot was obtained for NFZ analysis at a modified dsDNA/GCE (concentration range: 2.50×10⁻⁶–3.75×10⁻⁵ mol L−1; limit of detection: 8.0×10⁻⁷ mol L−1), and NFZ was determined successfully in pharmaceutical samples.Highlights► Electrochemical method was used to imitate the metabolic process of NFZ. ► Indirect and direct methods were used to detect the DNA damage by DNA biosensor. ► Quantitative determination of the NFZ by DNA biosensor. ► The interaction between nitro-radicals and DNA was intuitively studied. ► Both NFZ and its nitro-radicals can damage DNA. ► The metabolic product nitro-radicals were more dangerous than NFZ itself.
Co-reporter:Yao Gu, Yongnian Ni, and Serge Kokot
The Journal of Physical Chemistry A 2012 Volume 116(Issue 36) pp:8949-8958
Publication Date(Web):August 24, 2012
DOI:10.1021/jp306051w
A novel, simple and direct fluorescence method for analysis of complex substances and their potential substitutes has been researched and developed. Measurements involved excitation and emission (EEM) fluorescence spectra of powdered, complex, medicinal herbs, Cortex Phellodendri Chinensis (CPC) and the similar Cortex Phellodendri Amurensis (CPA); these substances were compared and discriminated from each other and the potentially adulterated samples (Caulis mahoniae (CM) and David poplar bark (DPB)). Different chemometrics methods were applied for resolution of the complex spectra, and the excitation spectra were found to be the most informative; only the rank-ordering PROMETHEE method was able to classify the samples with single ingredients (CPA, CPC, CM) or those with binary mixtures (CPA/CPC, CPA/CM, CPC/CM). Interestingly, it was essential to use the geometrical analysis for interactive aid (GAIA) display for a full understanding of the classification results. However, these two methods, like the other chemometrics models, were unable to classify composite spectral matrices consisting of data from samples of single ingredients and binary mixtures; this suggested that the excitation spectra of the different samples were very similar. However, the method is useful for classification of single-ingredient samples and, separately, their binary mixtures; it may also be applied for similar classification work with other complex substances.
Co-reporter:Yongnian Ni, Shuzhen Li, Serge Kokot
Food Chemistry 2011 Volume 124(Issue 3) pp:1157-1163
Publication Date(Web):1 February 2011
DOI:10.1016/j.foodchem.2010.07.028
The new simple, cost effective and well performing differential pulse stripping voltammetry method for the simultaneous determination of antibiotics – oxytetracycline, tetracycline and chlorotetracycline was researched and developed. It depends on the reduction of these compounds at a hanging mercury drop electrode. The samples were extracted from (i) spiked animal feed, and (ii) fresh fish muscle dosed with the drugs. The voltammograms from the drug mixture produced complex, overlapping profiles, and chemometrics methods were applied for calibration modelling. The analytical linear ranges were within 0.02–0.18 μg mL−1 and the corresponding LODs were 3–5 μg L−1 for the three analytes. These values compare well with those from the HPLC and fluorescence methods in the literature. The % relative prediction errors from the verification trials were between 4% and 9% with % Recoveries being 103–107. Also, the % Recoveries of the antibiotics from animal feeds as measured by the new method were comparable with those from the HPLC analysis (85%), i.e. the method is highly competitive, especially as a screening approach.
Co-reporter:Yi Gui, Yong Nian Ni, Serge Kokot
Chinese Chemical Letters 2011 Volume 22(Issue 5) pp:591-594
Publication Date(Web):May 2011
DOI:10.1016/j.cclet.2010.12.014
The voltammetric behaviour of three 5-nitroimidazoles, metronidazole, tinidazole and ornidazole, was investigated, and a method was developed for the simultaneous determination of these compounds, based on their reduction at a hanging mercury drop electrode (HMDE) in pH 8.95 buffer with differential pulse voltammetric (DPV) approach. Well defined voltammetric waves with peak potentials of −692, −640 and −652 mV were observed for these compounds, respectively. It is difficult to determine them individually from their mixtures without preseparation, for their voltammetric peaks overlapped seriously, so the chemometrics were used to resolve the overlapped voltammogram and quantify the mixtures. The proposed method was successfully applied to the determination of three 5-nitroimidazoles in milk and honey samples.
Co-reporter:Yanhua Lai, Yongnian Ni, Serge Kokot
Vibrational Spectroscopy 2011 Volume 56(Issue 2) pp:154-160
Publication Date(Web):18 July 2011
DOI:10.1016/j.vibspec.2011.01.007
Near-infrared spectroscopy (NIRS) was applied for direct and rapid collection of characteristic spectra from Rhizoma Corydalis, a common traditional Chinese medicine (TCM), with the aim of developing a method for the classification of such substances according to their geographical origin. The powdered form of the TCM was collected from two such different sources, and their NIR spectra were pretreated by the wavelet transform (WT) method. A training set of such Rhizoma Corydalis spectral objects was modeled with the use of the least-squares support vector machines (LS-SVM), radial basis function artificial neural networks (RBF-ANN), partial least-squares discriminant analysis (PLS-DA) and K-nearest neighbors (KNN) methods. All the four chemometrics models performed reasonably on the basis of spectral recognition and prediction criteria, and the LS-SVM method performed best with over 95% success on both criteria. Generally, there are no statistically significant differences in all these four methods. Thus, the NIR spectroscopic method supported by all the four chemometrics models, especially the LS-SVM, are recommended for application to classify TCM, Rhizoma Corydalis, samples according to their geographical origin.
Co-reporter:Yingxia Wang, Yongnian Ni, Serge Kokot
Analytical Biochemistry 2011 Volume 419(Issue 2) pp:76-80
Publication Date(Web):15 December 2011
DOI:10.1016/j.ab.2011.08.009
The interaction of salbutamol (Sal), an animal growth promoter, with DNA was investigated by differential pulse voltammetry (DPV), cyclic voltammetry (CV), and fluorescence spectroscopy. An irreversible reduction was observed from the cyclic voltammograms, and the reaction mechanism involved a one-electron change irreversible oxidation. In the presence of DNA, the DPV peak current decreased and the Sal peak shifted to higher potentials, indicating that Sal interacted with DNA to form an intercalation Sal–DNA complex. In addition, reaction binding parameters were extracted from the DPV data with the use of the multivariate curve resolution–alternating least squares (MCR–ALS) method; the binding constant and ratio were found to be (2.0 ± 0.5) × 105 M−1 and 1:1, respectively. Quantitative voltammetric analysis of Sal was performed in the concentration range of 3.02 × 10⁻⁶ to 1.23 × 10⁻⁴ mol L−1, and it was found that the detection limit was 5.11 × 10⁻⁷ mol L−1 in the presence of 1.00 × 10⁻⁶ mol L−1 DNA. The method was applied for the determination of Sal in spiked urine and human serum samples, and the calibration was successfully verified.
Co-reporter:Yongnian Ni, Minghua Mei, Serge Kokot
Chemometrics and Intelligent Laboratory Systems 2011 Volume 105(Issue 2) pp:147-156
Publication Date(Web):15 February 2011
DOI:10.1016/j.chemolab.2010.12.003
An NIR spectroscopic method was researched and developed for the analysis of potato crisps (chips) chosen as an example of a common, cheap but complex product. Four similar types of the ‘original flavour’ potato chips from different manufacturers were analysed by NIR spectroscopy; as well, the quality parameters — fat, moisture, acid and peroxide values of the extracted oil were predicted. Principal component analysis (PCA) of the NIR data displayed the clustering of objects with respect to the type of chips.NIR spectra were rank-ordered with the use of the sparingly applied multiple criteria decision making (MCDM) ranking methods, PROMETHEE (Preference Ranking Organization METHod for Enrichment Evaluation) and GAIA (Geometrical Analysis for Interactive Aid), and a comprehensive quantitative description of the data was obtained.The four traditional parameters were predicted on the basis of the NIR spectra; the performance of the Partial Least Squares (PLS), and Kernel Partial Least Squares (KPLS) calibrations was compared with those from Least Squares-Support Vector Machines (LS-SVM) method. The LS-SVM calibrations, which model better data linearity and non-linearity, successfully predicted all four parameters.This work has demonstrated that NIR methodology with the use of chemometrics can describe comprehensively qualitative and quantitative properties of complex, processed substances as illustrated by the potato chips example, and indicated that this approach may be applied to other similar complex samples.
Co-reporter:Yongnian Ni, Yi Gui and Serge Kokot
Analytical Methods 2011 vol. 3(Issue 2) pp:385-392
Publication Date(Web):14 Dec 2010
DOI:10.1039/C0AY00445F
Three structurally similar catecholamines, adrenaline (AA), dopamine (DA) and noradrenaline (NA), which are neurotransmitters well known for their treatment of neural disorders and many other diseases, were investigated at a glassy carbon electrode (GCE) with the use of differential pulse stripping voltammetry (DPSV). The aim was to develop a simple, rapid and cost effective method of simultaneous analysis of these three substances in typical samples such as human urine. Each analyte showed typical reversible redox behaviour with the use of cyclic voltammetry in aqueous medium in the pH range of 4.0–7.9, and composite voltammograms of the three analytes were found to consist of three significantly overlapping peaks corresponding to the three individual substances. Thus, two- and three-way multi-variate data analysis methods were investigated. These included unfolding methods such as—partial least squares (UPLS), principal component regression (UPCR) and radial basis function-artificial neural networks (URBF-ANN), as well as trilinear models, such as parallel factor analysis (PARAFAC) and N-way PLS (NPLS). The results were compared with those obtained from two-way voltammetric data matrix with the use of conventional models, PLS, PCR and RBF-ANN. It was found that most of the three-way models, such as PARAFAC and UPLS, performed somewhat better than others on the basis of the %RPET (5.6∼5.9) and mean %Recovery (94∼102). The proposed methods were then applied for the determination of human urine samples spiked with the three catecholamines, and the results were satisfactory.
Co-reporter:Yong Nian Ni, Wei Lin
Chinese Chemical Letters 2011 Volume 22(Issue 12) pp:1473-1476
Publication Date(Web):December 2011
DOI:10.1016/j.cclet.2011.07.010
Near-infrared spectroscopy (NIR), which is generally used for online monitoring of the food analysis and production process, was applied to determine the internal quality of toothpaste samples. It is acknowledged that the spectra can be significantly influenced by non-linearities introduced by light scatter, therefore, four data preprocessing methods, including off-set correction, 1st-derivative, standard normal variate (SNV) and multiplicative scatter correction (MSC), were employed before the date analysis. The multivariate calibration model of partial least squares (PLS) was established and then was used to predict the pH values of the toothpaste samples of different brand. The results showed that the spectral date processed by MSC was the best one for predicting the pH value of the toothpaste samples.
Co-reporter:Yongnian Ni, Qiuhong Liu, Serge Kokot
Spectrochimica Acta Part A: Molecular and Biomolecular Spectroscopy 2011 Volume 78(Issue 1) pp:443-448
Publication Date(Web):January 2011
DOI:10.1016/j.saa.2010.11.007
Interaction of chlorotetracycline (CTC) with bovine serum albumin (BSA) was investigated under simulated physiological conditions by spectroscopy with the aid of multivariate curve resolution-alternating least squares (MCR-ALS). Eosin Y was selected as an alternative site I marker on the BSA to study the above molecular interaction. The binding of Eosin Y and CTC to BSA showed that CTC was displaced from CTC–BSA complex by Eosin Y, and Eosin Y–BSA complex was formed. However, the recorded fluorescence spectra of Eosin Y and Eosin Y–BSA overlapped and MCR-ALS was applied to resolve the two-way fluorescence spectra. From the resolved equilibrium concentration profiles, it was observed that Eosin Y competed with CTC in the binding process with BSA; it was also shown that the binding site of CTC on BSA was site I, and this was further confirmed by the fluorescence polarization method. Compared with some common site I markers for BSA, the fluorescence and UV–vis spectral shapes of the Eosin Y–BSA complex were quite different from that of Eosin Y, and this feature facilitated the investigation of the small molecule–BSA interaction.
Co-reporter:Yongnian Ni, Yingxia Wang, Serge Kokot
Sensors and Actuators B: Chemical 2011 Volume 156(Issue 1) pp:290-297
Publication Date(Web):10 August 2011
DOI:10.1016/j.snb.2011.04.035
The interaction of 10-hydroxycamptothecine (HCPT) with DNA under pseudo-physiological conditions (Tris–HCl buffer of pH 7.4), using ethidium bromide (EB) dye as a probe, was investigated with the use of spectrofluorimetry, UV–vis spectrometry and viscosity measurement. The binding constant and binding number for HCPT with DNA were evaluated as (7.1 ± 0.5) × 104 M−1 and 1.1, respectively, by multivariate curve resolution-alternating least squares (MCR-ALS). Moreover, parallel factor analysis (PARAFAC) was applied to resolve the three-way fluorescence data obtained from the interaction system, and the concentration information for the three components of the system at equilibrium was simultaneously obtained. It was found that there was a cooperative interaction between the HCPT–DNA complex and EB, which produced a ternary complex of HCPT–DNA–EB.
Co-reporter:YongNian Ni;JinFeng Chen;Serge Kokot
Science China Chemistry 2011 Volume 54( Issue 5) pp:827-834
Publication Date(Web):2011 May
DOI:10.1007/s11426-010-4125-6
This paper describes a kinetic spectrophotometric method for simultaneous determination of three cephalosporin antibiotics, cephradine, cefaclor and cefixime, with the aid of chemometrics. The method relies on their oxidation with KMnO4 to produce green manganate with different kinetic rates in alkaline medium. The proposed method was successfully applied to a pharmacokinetic study of three cephalosporin antibiotics in rabbit plasma via intravenous injections. The results indicated that the amount of cephradine, cefaclor and cefixime were reduced rapidly in rabbit blood, showing clear dose-dependency and the half-life of cefixime (160 min) was longer than those of cephradine (60 min) and cefaclor (60 min).
Co-reporter:Yongnian Ni;Yao Gu;Serge Kokot
Chemical Papers 2011 Volume 65( Issue 6) pp:
Publication Date(Web):2011 December
DOI:10.2478/s11696-011-0090-6
A rapid kinetic method for the simultaneous determination of levodopa, dopamine, and dobutamine was examined and developed. It was based on a consecutive reaction of a reduction of Cu(II) to Cu(I) by catecholamines, followed by the complexation of Cu(I) with neocuproine to form a yellow product in an acetic acid-acetate buffer. Spectrophotometric data were recorded at 453 nm (wavelength at the yellow complex absorption maximum) for 300 s. Linear calibrations were obtained in the concentration ranges of (0.08–1.44) × 10−5 mol L−1, (0.08–1.44) × 10−5 mol L−1, and (0.16–1.44) × 10−5 mol L−1 for levodopa, dopamine, and dobutamine, respectively. A variety of multivariate calibration models was developed for simultaneous analysis of the three analytes; while most models produced satisfactory prediction results for synthetic samples, the hybrid linear analysis method was arguably the best-performing (relative prediction error, RPET = 6.6 %). The proposed method was applied to an analysis of spiked rabbit serum samples and the results showed good agreement with the high performance liquid chromatography measurements.
Co-reporter:Yongnian Ni, Shuangshuang Wang, Serge Kokot
Analytica Chimica Acta 2010 Volume 663(Issue 2) pp:139-146
Publication Date(Web):24 March 2010
DOI:10.1016/j.aca.2010.01.053
The binding interaction of Alpinetin (APT) with bovine serum albumin (BSA) was studied by fluorescence, UV–visible and synchronous fluorescence spectroscopy (SFS) under simulated physiological conditions. The measured complex spectra were resolved by multivariate curve resolution-alternating least squares (MCR-ALS), yielding a host of data and information, which otherwise would have been impossible to obtain. The extracted profiles corresponded to the spectra of the single species in the APT/BSA mixture. In addition, the presence of the APT–BSA complex was demonstrated, and it was shown that the associated quenching of the fluorescence from the BSA protein resulted from the formation of APT–BSA complex via a static mechanism. The binding constant (Ka(ave) = 2.34 × 10⁶ L mol−1) and the number of sites (n = 1) were obtained by fluorescence methods as were the thermodynamic parameters (ΔH0, ΔS0 and ΔG0). This work suggested that the principal binding between APT to BSA was facilitated by hydrophobic interactions. The thermodynamic parameters for APT were compared to those from the structurally similar Chrysin and Wogonin molecules. It appeared that the entropy parameters were relatively more affected by the small structural changes. SFS from the interaction of BSA and APT showed that the ligand affected the conformation of BSA. The competitive interaction of APT and site makers with BSA indicated site I as the binding area of APT in BSA.
Co-reporter:Yongnian Ni, Qiulan Zhang and Serge Kokot
Analyst 2010 vol. 135(Issue 8) pp:2059-2068
Publication Date(Web):11 Jun 2010
DOI:10.1039/C0AN00161A
β-Agonists such as ractopamine (RAC) and clenbuterol (CLEN), have similar effects as anabolic steroids i.e. they promote growth of muscular tissue and reduce body fat. They have been used successfully with animals and humans but have also been banned in many countries principally, because of their serious side effects. However, their illegal use persists. Thus, their interaction with biomolecules such as bovine serum albumin (BSA) is of significance, especially the co-operative reaction of mixed ligands with the protein. Fluorescence and UV-vis spectra of complex mixtures of individual ligands, binary and ternary complexes with BSA resulted in significantly overlapping spectral profiles. Qualitative and quantitative information about the various complex ligand-protein species formed, was obtained with the resolution of the excitation-emission fluorescence three-way data matrices by chemometrics methods-MCR-ALS and PARAFAC. Individual spectra of the ligands, their binary complexes with BSA and their ternary complexes were extracted, and quantitative concentration profiles for each species in a particular interaction were constructed. Such analyses made it possible to interpret the role and behaviour of each reaction component. It was found that both ligands, RAC and CLEN, bound co-operatively in site I of the BSA. This was confirmed with the use of site markers such as warfarin (site I) and ibuprofen (site II). However, CLEN formed a 1:1 CLEN-BSA complex, while RAC formed a 2:1 RAC2-BSA binary species. Interestingly, when CLEN or RAC was added to RAC2-BSA or CLEN-BSA, respectively, ternary complexes were produced such as RAC2-BSA-CLEN. Significantly, the presence of the second ligand in such an interaction in excess, appeared to increase the affinity of the added ligand for BSA. This may have consequences on the amount of steroid required to achieve a desired tissue growth effect.
Co-reporter:Yongnian Ni, Na Deng and Serge Kokot
Analytical Methods 2010 vol. 2(Issue 9) pp:1302-1309
Publication Date(Web):23 Jul 2010
DOI:10.1039/C0AY00213E
A new kinetic spectrophotometric method for simultaneous determination of chlortetracycline, tetracycline and oxytetracycline in real samples has been researched and developed. The method was based on the kinetic reaction involving the oxidation of the drugs by alkaline potassium permanganate at 40 °C. After the addition of these drugs, an increasing absorbance at 526 nm and a decreasing absorbance at 608 nm caused by manganate and permanganate, respectively, were observed. The three-way kinetic-spectral data in the 325–725 nm range from 0 to 360 s were collected and applied to build chemometrics models. The plot of absorbance versus concentration was rectilinear over the 0.05–0.75 µg mL−1 range for chlortetracycline and tetracycline, and 0.02–0.34 µg mL−1 for oxytetracycline, with the limit of detection of 0.013, 0.015 and 0.011 µg mL−1, respectively. The experimental conditions were carefully investigated to optimize the development and stability of the color products (potassium manganate). The proposed method was successfully applied to the simultaneous determination of tetracyclines (TCs) in feed and muscle samples, and the results showed satisfactory agreement with those from of the HPLC method.
Co-reporter:Na Deng;Yongnian Ni;Serge Kokot
Chinese Journal of Chemistry 2010 Volume 28( Issue 3) pp:404-410
Publication Date(Web):
DOI:10.1002/cjoc.201090087
Abstract
A spectrophotometric method for simultaneous analysis of methamidophos and fenitrothion was proposed by application of chemometrics to the spectral kinetic data, which was based upon the difference in the inhibitory effect of the two pesticides on acetylcholinesterase (AChE) and the use of 5,5′-dithiobis(2-nitrobenzoic acid) (DTNB) as a chromogenic reagent for the thiocholine iodide (TChI) released from the acetylthiocholine iodide (ATChI) substrate. The absorbance of the chromogenic product was measured at 412 nm. The different experimental conditions affecting the development and stability of the chromogenic product were carefully studied and optimized. Linear calibration graphs were obtained in the concentration range of 0.5–7.5 ng·mL−1 and 5–75 ng·mL−1 for methamidophos and fenitrothion, respectively. Synthetic mixtures of the two pesticides were analysed, and the data obtained processed by chemometrics, such as partial least square (PLS), principal component regression (PCR), back propagation-artificial neural network (BP-ANN), radial basis function-artificial neural network (RBF-ANN) and principal component-radial basis function-artificial neural network (PC-RBF-ANN). The results show that the RBF-ANN gives the lowest prediction errors of the five chemometric methods. Following the validation of the proposed method, it was applied to the determination of the pesticides in several commercial fruit and vegetable samples; and the standard addition method yielded satisfactory recoveries.
Co-reporter:Yan Hua Lai, Yong Nian Ni, Serge Kokot
Chinese Chemical Letters 2010 Volume 21(Issue 2) pp:213-216
Publication Date(Web):February 2010
DOI:10.1016/j.cclet.2009.10.031
High performance liquid chromatographic (HPLC) fingerprints of Cassia seed, a traditional Chinese medicine (TCM), were developed by means of the chromatograms at two wavelengths of 238 and 282 nm. Then, the two data sets were combined into one matrix. The application of principal component analysis (PCA) for this data matrix showed that the samples were clustered into four groups in accordance with the plant sources and preparation procedures. Furthermore, partial least squares (PLS), back propagation artificial neural network (BP-ANN), and radial basis function artificial neural network (RBF-ANN) were effectively applied to predict the category of the four different samples in the test set.
Co-reporter:Ying Xia Wang, Yong Nian Ni, Serge Kokot
Chinese Chemical Letters 2010 Volume 21(Issue 8) pp:963-967
Publication Date(Web):August 2010
DOI:10.1016/j.cclet.2010.03.015
The interactions of carbofuran and DNA were studied using voltammetry and fluorescence spectroscopy. The formation of carbofuran–DNA makes the current peak of DNA decreased by voltammetry method. The binding number (n) and constant (Ka) for complex carbofuran–DNA were calculated to be 1.06 ± 0.04 and 0.11 ± 0.03 mol−1 L, respectively by fluorescence measurement. Chemometrics approach, such as singular value decomposition (SVD) was used to evaluate the number of spectral species in the drug–DNA binding process. And the pure spectra and concentration profiles in the kinetic system were clearly deduced by multivariate curve resolution alternating least squares (MCR-ALS) with the initial estimates by evolving factor analysis (EFA).
Co-reporter:Qiulan Zhang, Yongnian Ni, Serge Kokot
Journal of Pharmaceutical and Biomedical Analysis 2010 52(2) pp: 280-288
Publication Date(Web):
DOI:10.1016/j.jpba.2010.01.006
Co-reporter:Yongnian Ni, Shaojing Su, Serge Kokot
Spectrochimica Acta Part A: Molecular and Biomolecular Spectroscopy 2010 Volume 75(Issue 2) pp:547-552
Publication Date(Web):February 2010
DOI:10.1016/j.saa.2009.11.014
The interaction between fluoroquinolones (FQs), ofloxacin and enrofloxacin, and bovine serum albumin (BSA) was investigated by fluorescence and UV–vis spectroscopy. It was demonstrated that the fluorescence quenching of BSA by FQ is a result of the formation of the FQ–BSA complex stabilized, in the main, by hydrogen bonds and van der Waals forces. The Stern–Volmer quenching constant, KSV, and the corresponding thermodynamic parameters, ΔH, ΔS and ΔG, were estimated. The distance, r, between the donor, BSA, and the acceptor, FQ, was estimated from fluorescence resonance energy transfer (FRET). The effect of FQ on the conformation of BSA was analyzed with the aid of UV–vis absorbance spectra and synchronous fluorescence spectroscopy. Spectral analysis showed that the two FQs affected the conformation of the BSA but in a different manner. Thus, with ofloxacin, the polarity around the tryptophan residues decreased and the hydrophobicity increased, while for enrofloxacin, the opposite effect was observed.
Co-reporter:Yongnian Ni, Yanhua Lai, Sarina Brandes, Serge Kokot
Analytica Chimica Acta 2009 Volume 647(Issue 2) pp:149-158
Publication Date(Web):11 August 2009
DOI:10.1016/j.aca.2009.06.021
Multi-wavelength fingerprints of Cassia seed, a traditional Chinese medicine (TCM), were collected by high-performance liquid chromatography (HPLC) at two wavelengths with the use of diode array detection. The two data sets of chromatograms were combined by the data fusion-based method. This data set of fingerprints was compared separately with the two data sets collected at each of the two wavelengths. It was demonstrated with the use of principal component analysis (PCA), that multi-wavelength fingerprints provided a much improved representation of the differences in the samples. Thereafter, the multi-wavelength fingerprint data set was submitted for classification to a suite of chemometrics methods viz. fuzzy clustering (FC), SIMCA and the rank ordering MCDM PROMETHEE and GAIA. Each method highlighted different properties of the data matrix according to the fingerprints from different types of Cassia seeds. In general, the PROMETHEE and GAIA MCDM methods provided the most comprehensive information for matching and discrimination of the fingerprints, and appeared to be best suited for quality assurance purposes for these and similar types of sample.
Co-reporter:Yongnian Ni, Shan Du and Serge Kokot
Analyst 2009 vol. 134(Issue 9) pp:1840-1847
Publication Date(Web):30 Jun 2009
DOI:10.1039/B904018H
Three commonly used fluoroquinolone antibiotics (norfloxacin (NFX), ofloxacin (OFX) and lomefloxacin (LMFX)) were used as examples of molecules which can interact with a biomacromolecule, such as DNA, separately or in a mixture. Such interactions were investigated with the use of UV and Synchronous Fluorescence Spectroscopy (SFS). Equilibrium binding (Kap) and Stern–Volmer equilibrium (KSV) constants were extracted from these two types of spectra from interactions of DNA with single fluoroquinolones. The values of these equilibrium constants were relatively low, and this suggested that the DNA groove was the likely binding site. The complex SFS profiles obtained from the interactions of the DNA with the drug analyte mixtures were resolved, with the use of the curve resolution method, parallel factor (PARAFAC) analysis, into spectra of individual drugs. From these spectra, the (KSV) values for the individual analytes in the mixture were obtained. Also extracted were the concentrations of the individual quinolones as a function of concentration of the DNA. From a comparison of the equilibrium constants for the individual drug–DNA interaction with those obtained from the interaction with the drugs in a mixture, it was found that the binding strength of a single analyte to DNA was LMFX > NFX > OFX, but when the drug mixture was involved, this order was reversed. Importantly, it was also found that the equilibrium uptake of the drugs OFX and NFX was higher than from single drug–DNA experiments; the concentrations of LMFX did not change significantly. These observations collectively suggested that the binding of NFX and OFX to DNA is synergistically affected and that they probably share similar binding sites, while the LMFX was bound to a different site. This new important qualitative and quantitative information, which can now act as a springboard for more complex and deeper studies of the apparent synergistic effects of drug interactions with biomacromolecules, could only be obtained by the combination of three-way array SFS measurements and their interpretation by a chemometrics curve resolution method such as PARAFAC.
Co-reporter:Yongnian Ni, Weiqiang Xiao, Serge Kokot
Food Chemistry 2009 Volume 113(Issue 4) pp:1339-1345
Publication Date(Web):15 April 2009
DOI:10.1016/j.foodchem.2008.08.068
A simple and sensitive spectrophotometric method for the simultaneous determination of acesulfame-K, sodium cyclamate and saccharin sodium sweeteners in foodstuff samples has been researched and developed. This analytical method relies on the different kinetic rates of the analytes in their oxidative reaction with KMnO4 to produce the green manganate product in an alkaline solution. As the kinetic rates of acesulfame-K, sodium cyclamate and saccharin sodium were similar and their kinetic data seriously overlapped, chemometrics methods, such as partial least squares (PLS), principal component regression (PCR) and classical least squares (CLS), were applied to resolve the kinetic data. The results showed that the PLS prediction model performed somewhat better. The proposed method was then applied for the determination of the three sweeteners in foodstuff samples, and the results compared well with those obtained by the reference HPLC method.
Co-reporter:Yan Qing Chen, Yong Nian Ni
Chinese Chemical Letters 2009 Volume 20(Issue 5) pp:615-619
Publication Date(Web):May 2009
DOI:10.1016/j.cclet.2009.01.006
Benzoic acid (BA), methylparaben (MP), propylparaben (PP) and sorbic acid (SA) are food preservatives, and they have well defined UV spectra. However, their spectra overlap seriously, and it is difficult to determine them individually from their mixtures without preseparation. In this paper, seven different chemometric approaches were applied to resolve the overlapping spectra and to determine these compounds simultaneously. With respect to the criteria of % relative prediction error (RPE) and % recovery, principal component regression (PCR) and radial basis function–artificial neural network (RBF–ANN) were the preferred methods. These two methods were successfully applied to the analysis of some commercial samples.
Co-reporter:Yongnian Ni, Yong Wang, Serge Kokot
Talanta 2009 Volume 78(Issue 2) pp:432-441
Publication Date(Web):30 April 2009
DOI:10.1016/j.talanta.2008.11.035
This paper describes a simple and sensitive kinetic spectrophotometric method for the simultaneous determination of Amaranth, Ponceau 4R, Sunset Yellow, Tartrazine and Brilliant Blue in mixtures with the aid of chemometrics. The method involved two coupled reactions, viz. the reduction of iron(III) by the analytes to iron(II) in sodium acetate/hydrochloric acid solution (pH 1.71) and the chromogenic reaction between iron(II) and hexacyanoferrate(III) ions to yield a Prussian blue peak at 760 nm. The spectral data were recorded over the 500–1000 nm wavelength range every 2 s for 600 s. The kinetic data were collected at 760 nm and 600 s, and linear calibration models were satisfactorily constructed for each of the dyes with detection limits in the range of 0.04–0.50 mg L−1. Multivariate calibration models for kinetic data were established and verified for methods such as the Iterative target transform factor analysis (ITTFA), principal component regression (PCR), partial least squares (PLS), and principal component-radial basis function-artificial neural network (PC-RBF-ANN) with and without wavelet packet transform (WPT) pre-treatment. The PC-RBF-ANN with WPT calibration performed somewhat better than others on the basis of the %RPET (∼9) and %Recovery parameters (∼108), although the effect of the WPT pre-treatment was marginal (∼0.5% RPET). The proposed method was applied for the simultaneous determination of the five colorants in foodstuff samples, and the results were comparable with those from a reference HPLC method.
Co-reporter:Yongnian Ni, Xia Zhang, Serge Kokot
Spectrochimica Acta Part A: Molecular and Biomolecular Spectroscopy 2009 Volume 71(Issue 5) pp:1865-1872
Publication Date(Web):January 2009
DOI:10.1016/j.saa.2008.07.004
The interaction of quercetin, which is a bioflavonoid, with bovine serum albumin (BSA) was investigated under pseudo-physiological conditions by the application of UV–vis spectrometry, spectrofluorimetry and cyclic voltammetry (CV). These studies indicated a cooperative interaction between the quercetin–BSA complex and warfarin, which produced a ternary complex, quercetin–BSA–warfarin. It was found that both quercetin and warfarin were located in site I. However, the spectra of these three components overlapped and the chemometrics method – multivariate curve resolution-alternating least squares (MCR-ALS) was applied to resolve the spectra.The resolved spectra of quercetin–BSA and warfarin agreed well with their measured spectra, and importantly, the spectrum of the quercetin–BSA–warfarin complex was extracted. These results allowed the rationalization of the behaviour of the overlapping spectra. At lower concentrations ([warfarin] < 1 × 10⁻⁵ mol L−1), most of the site marker reacted with the quercetin–BSA, but free warfarin was present at higher concentrations. Interestingly, the ratio between quercetin–BSA and warfarin was found to be 1:2, suggesting a quercetin–BSA–(warfarin)2 complex, and the estimated equilibrium constant was 1.4 × 10¹¹ M−2. The results suggest that at low concentrations, warfarin binds at the high-affinity sites (HAS), while low-affinity binding sites (LAS) are occupied at higher concentrations.
Co-reporter:Yongnian Ni, Daiqin Lin, Serge Kokot
Analytica Chimica Acta 2008 Volume 606(Issue 1) pp:19-25
Publication Date(Web):7 January 2008
DOI:10.1016/j.aca.2007.10.051
Synchronous fluorescence spectroscopy (SFS) was applied for the investigation of interactions of the antibiotic, tetracycline (TC), with DNA in the presence of aluminium ions (Al3+). The study was facilitated by the use of the Methylene Blue (MB) dye probe, and the interpretation of the spectral data with the aid of the chemometrics method, parallel factor analysis (PARAFAC). Three-way synchronous fluorescence analysis extracted the important optimum constant wavelength differences, Δλ, and showed that for the TC–Al3+–DNA, TC–Al3+ and MB dye systems, the associated Δλ values were different (Δλ = 80, 75 and 30 nm, respectively). Subsequent PARAFAC analysis demonstrated the extraction of the equilibrium concentration profiles for the TC–Al3+, TC–Al3+–DNA and MB probe systems. This information is unobtainable by conventional means of data interpretation. The results indicated that the MB dye interacted with the TC–Al3+–DNA surface complex, presumably via a reaction intermediate, TC–Al3+–DNA–MB, leading to the displacement of the TC–Al3+ by the incoming MB dye probe.
Co-reporter:Yongnian Ni, Serge Kokot
Analytica Chimica Acta 2008 Volume 626(Issue 2) pp:130-146
Publication Date(Web):26 September 2008
DOI:10.1016/j.aca.2008.08.009
This review explores the question whether chemometrics methods enhance the performance of electroanalytical methods. Electroanalysis has long benefited from the well-established techniques such as potentiometric titrations, polarography and voltammetry, and the more novel ones such as electronic tongues and noses, which have enlarged the scope of applications. The electroanalytical methods have been improved with the application of chemometrics for simultaneous quantitative prediction of analytes or qualitative resolution of complex overlapping responses. Typical methods include partial least squares (PLS), artificial neural networks (ANNs), and multiple curve resolution methods (MCR-ALS, N-PLS and PARAFAC). This review aims to provide the practising analyst with a broad guide to electroanalytical applications supported by chemometrics. In this context, after a general consideration of the use of a number of electroanalytical techniques with the aid of chemometrics methods, several overviews follow with each one focusing on an important field of application such as food, pharmaceuticals, pesticides and the environment. The growth of chemometrics in conjunction with electronic tongue and nose sensors is highlighted, and this is followed by an overview of the use of chemometrics for the resolution of complicated profiles for qualitative identification of analytes, especially with the use of the MCR-ALS methodology. Finally, the performance of electroanalytical methods is compared with that of some spectrophotometric procedures on the basis of figures-of-merit. This showed that electroanalytical methods can perform as well as the spectrophotometric ones. PLS-1 appears to be the method of practical choice if the %relative prediction error of ∼±10% is acceptable.
Co-reporter:Yongnian Ni, Shaojing Su, Serge Kokot
Analytica Chimica Acta 2008 Volume 628(Issue 1) pp:49-56
Publication Date(Web):17 October 2008
DOI:10.1016/j.aca.2008.08.033
Interactions between small molecules with biopolymers e.g. the bovine serum albumin (BSA protein), are important, and significant information is recorded in the UV–vis and fluorescence spectra of their reaction mixtures. The extraction of this information is difficult conventionally and principally because there is significant overlapping of the spectra of the three analytes in the mixture. The interaction of berberine chloride (BC) and the BSA protein provides an interesting example of such complex systems. UV–vis and fluorescence spectra of BC and BSA mixtures were investigated in pH 7.4 Tris–HCl buffer at 37 °C. Two sample series were measured by each technique: (1) [BSA] was kept constant and the [BC] was varied and (2) [BC] was kept constant and the [BSA] was varied. This produced four spectral data matrices, which were combined into one expanded spectral matrix. This was processed by the multivariate curve resolution–alternating least squares method (MCR–ALS). The results produced: (1) the extracted pure BC, BSA and the BC–BSA complex spectra from the measured heavily overlapping composite responses, (2) the concentration profiles of BC, BSA and the BC–BSA complex, which are difficult to obtain by conventional means, and (3) estimates of the number of binding sites of BC.
Co-reporter:Yongnian Ni, Yunyan Peng, Serge Kokot
Analytica Chimica Acta 2008 Volume 616(Issue 1) pp:19-27
Publication Date(Web):26 May 2008
DOI:10.1016/j.aca.2008.04.015
The molecular and metal profile fingerprints were obtained from a complex substance, Atractylis chinensis DC—a traditional Chinese medicine (TCM), with the use of the high performance liquid chromatography (HPLC) and inductively coupled plasma atomic emission spectroscopy (ICP-AES) techniques. This substance was used in this work as an example of a complex biological material, which has found application as a TCM. Such TCM samples are traditionally processed by the Bran, Cut, Fried and Swill methods, and were collected from five provinces in China. The data matrices obtained from the two types of analysis produced two principal component biplots, which showed that the HPLC fingerprint data were discriminated on the basis of the methods for processing the raw TCM, while the metal analysis grouped according to the geographical origin. When the two data matrices were combined into a one two-way matrix, the resulting biplot showed a clear separation on the basis of the HPLC fingerprints. Importantly, within each different grouping the objects separated according to their geographical origin, and they ranked approximately in the same order in each group. This result suggested that by using such an approach, it is possible to derive improved characterisation of the complex TCM materials on the basis of the two kinds of analytical data.In addition, two supervised pattern recognition methods, K-nearest neighbors (KNNs) method, and linear discriminant analysis (LDA), were successfully applied to the individual data matrices—thus, supporting the PCA approach.
Co-reporter:Yongnian Ni, Yong Wang, Serge Kokot
Food Chemistry 2008 Volume 109(Issue 2) pp:431-438
Publication Date(Web):15 July 2008
DOI:10.1016/j.foodchem.2007.12.036
A fast and accurate procedure has been researched and developed for the simultaneous determination of maltol and ethyl maltol, based on their reaction with iron(III) in the presence of o-phenanthroline in sulfuric acid medium. This reaction was the basis for an indirect kinetic spectrophotometric method, which followed the development of the pink ferroin product (λmax = 524 nm). The kinetic data were collected in the 370–900 nm range over 0–30 s. The optimized method indicates that individual analytes followed Beer’s law in the concentration range of 4.0–76.0 mg L−1 for both maltol and ethyl maltol. The LOD values of 1.6 mg L−1 for maltol and 1.4 mg L−1 for ethyl maltol agree well with those obtained by the alternative high performance liquid chromatography with ultraviolet detection (HPLC-UV). Three chemometrics methods, principal component regression (PCR), partial least squares (PLS) and principal component analysis–radial basis function–artificial neural networks (PC–RBF–ANN), were used to resolve the measured data with small kinetic differences between the two analytes as reflected by the development of the pink ferroin product. All three performed satisfactorily in the case of the synthetic verification samples, and in their application for the prediction of the analytes in several food products. The figures of merit for the analytes based on the multivariate models agreed well with those from the alternative HPLC-UV method involving the same samples.
Co-reporter:Ping Qiu, Yong Nian Ni
Chinese Chemical Letters 2008 Volume 19(Issue 11) pp:1337-1340
Publication Date(Web):November 2008
DOI:10.1016/j.cclet.2008.07.013
The electrochemical behaviour and electrode reaction mechanism of ziram (zinc-dimethyl dithiocarbamate) on a hanging mercury drop electrode were investigated in Britton–Robinson (B–R) buffer by using cyclic and square wave voltammetry (SWV). Based on these studies a voltammetric method for determination of ziram was developed and applied to determine the ziram in synthetic and spiked vegetable samples, satisfactory results were obtained in both cases.
Co-reporter:Yong Nian Ni, Wei Qiang Xiao
Chinese Chemical Letters 2008 Volume 19(Issue 8) pp:981-984
Publication Date(Web):August 2008
DOI:10.1016/j.cclet.2008.05.021
A procedure for the simultaneous kinetic spectrophotometric determination of cephalexin and trimethoprim was described. It was based on the different reaction rate of oxidation of these compounds with yellow ammonium cerous (IV) sulfate in acidic medium and colorless cerous (III) sulfate was produced. The overlapped kinetic data was quantitatively resolved by the use of chemometric methods, partial least squares (PLS), principal component regression (PCR) and radial basis function-artificial neural network (RBF-ANN). The proposed method was also applied to the simultaneous determination of cephalexin and trimethoprim in pharmaceutical preparation and human urine with satisfied results, which compared well with those obtained by HPLC.
Co-reporter:Yong Nian Ni, Yue Rong Wang, Serge Kokot
Chinese Chemical Letters 2008 Volume 19(Issue 12) pp:1491-1494
Publication Date(Web):December 2008
DOI:10.1016/j.cclet.2008.09.052
A method for determination of lactose in food samples by Osteryoung square wave voltammetry (OSWV) was developed. It was based on the nucleophilic addition reaction between lactose and aqua ammonia. The carbonyl group of lactose can be changed into imido group, and this increases the electrochemical activity in reduction and the sensitivity. The optimal condition for the nucleophilic addition reaction was investigated and it was found that in NH4Cl–NH3 buffer of pH 10.1, the linear range between the peak current and the concentration of lactose was 0.6–8.4 mg L−1, and the detection limits was 0.44 mg L−1. The proposed method was applied to the determination of lactose in food samples and satisfactory results were obtained.
Co-reporter:Yongnian Ni, Genlan Liu, Serge Kokot
Talanta 2008 Volume 76(Issue 3) pp:513-521
Publication Date(Web):30 July 2008
DOI:10.1016/j.talanta.2008.03.037
The binding interaction of the pesticide Isoprocarb and its degradation product, sodium 2-isopropylphenate, with bovine serum albumin (BSA) was studied by spectrofluorimetry under simulated physiological conditions. Both Isoprocarb and sodium 2-isopropylphenate quenched the intrinsic fluorescence of BSA. This quenching proceeded via a static mechanism. The thermodynamic parameters (ΔH°, ΔS° and ΔG°) obtained from the fluorescence data measured at two different temperatures showed that the binding of Isoprocarb to BSA involved hydrogen bonds and that of sodium 2-isopropylphenate to BSA involved hydrophobic and electrostatic interactions. Synchronous fluorescence spectroscopy of the interaction of BSA with either Isoprocarb or sodium 2-isopropylphenate showed that the molecular structure of the BSA was changed significantly, which is consistent with the known toxicity of the pesticide, i.e., the protein is denatured. The sodium 2-isopropylphenate, was estimated to be about 4–5 times more toxic than its parent, Isoprocarb.Synchronous fluorescence spectroscopy and the resolution of the three-way excitation–emission fluorescence spectra by the PARAFAC method extracted the relative concentration profiles of BSA, Isoprocab and sodium 2-isopropylphenate as a function of the added sodium 2-isopropylphenate. These profiles showed that the degradation product, sodium 2-isopropylphenate, displaced the pesticide in a competitive reaction with the BSA protein.
Co-reporter:Yongnian Ni;Yunyan Peng;Serge Kokot
Chromatographia 2008 Volume 67( Issue 3-4) pp:211-217
Publication Date(Web):2008 February
DOI:10.1365/s10337-007-0500-7
Chromatographic fingerprints of 46 Eucommia Bark samples were obtained by liquid chromatography-diode array detector (LC-DAD). These samples were collected from eight provinces in China, with different geographical locations, and climates. Seven common LC peaks that could be used for fingerprinting this common popular traditional Chinese medicine were found, and six were identified as substituted resinols (4 compounds), geniposidic acid and chlorogenic acid by LC-MS. Principal components analysis (PCA) indicated that samples from the Sichuan, Hubei, Shanxi and Anhui—the SHSA provinces, clustered together. The other objects from the four provinces, Guizhou, Jiangxi, Gansu and Henan, were discriminated and widely scattered on the biplot in four province clusters. The SHSA provinces are geographically close together while the others are spread out. Thus, such results suggested that the composition of the Eucommia Bark samples was dependent on their geographic location and environment. In general, the basis for discrimination on the PCA biplot from the original 46 objects× 7 variables data matrix was the same as that for the SHSA subset (36 × 7 matrix). The seven marker compound loading vectors grouped into three sets: (1) three closely correlating substituted resinol compounds and chlorogenic acid; (2) the fourth resinol compound identified by the OCH3 substituent in the R4 position, and an unknown compound; and (3) the geniposidic acid, which was independent of the set 1 variables, and which negatively correlated with the set 2 ones above. These observations from the PCA biplot were supported by hierarchical cluster analysis, and indicated that Eucommia Bark preparations may be successfully compared with the use of the HPLC responses from the seven marker compounds and chemometric methods such as PCA and the complementary hierarchical cluster analysis (HCA).
Co-reporter:Yong Wang;YongNian Ni;Serge Kokot
Science China Chemistry 2008 Volume 51( Issue 8) pp:776-785
Publication Date(Web):2008 August
DOI:10.1007/s11426-008-0083-7
A kinetic spectrophotometric method with aid of chemometrics is proposed for the simultaneous determination of norfloxacin and rifampicin in mixtures. The proposed method was applied for the simultaneous determination of these two compounds in pharmaceutical formulation and human urine samples, and the results obtained are similar to those obtained by high performance liquid chromatography.
Co-reporter:Yongnian Ni, Chunfang Huang, Serge Kokot
Analytica Chimica Acta 2007 Volume 599(Issue 2) pp:209-218
Publication Date(Web):19 September 2007
DOI:10.1016/j.aca.2007.08.005
A differential kinetic spectrophotometric method was researched and developed for the simultaneous determination of iron and aluminium in food samples. It was based on the direct reaction kinetics and spectrophotometry of these two metal ions with Chrome Azurol S (CAS) in ethylenediamine–hydrochloric acid buffer (pH 6.3). The results were interpreted with the use of chemometrics. The kinetic runs and the visible spectra of the complex formation reaction were studied between 540 and 750 nm every 30 s over a total period of 285 s. A set of synthetic metal mixture samples was used to build calibrations models. These were based on the spectral and kinetic two-way data matrices, which were processed separately by the radial basis function-artificial neural network (global RBF-ANN) method. The prediction performance of these models was poorer than that from the combined kinetic-spectral three-way array, which was similarly processed by the same method (% relative prediction error (RPET) = 5.6). These results demonstrate that improved predictions can be obtained from the data array, which has more information, and that appropriate chemometrics methods can enhance analytical performance of simple techniques such as spectrophotometry.Other chemometrics models were then applied: N-way partial least squares (NPLS), parallel factor analysis (PARAFAC), back propagation-artificial neural network (BP-ANN), single radial basis function-artificial neural network (RBF-ANN), and principal component neural network (PC-RBF-ANN). There was no substantial difference between the methods with the overall %RPET range being 5.0–5.8. These two values corresponded to the NPLS and BP-ANN models, respectively. The proposed method was applied for the determination of iron and aluminium in some commercial food samples with satisfactory results.
Co-reporter:Yongnian Ni, Dongxia Cao, Serge Kokot
Analytica Chimica Acta 2007 Volume 588(Issue 1) pp:131-139
Publication Date(Web):4 April 2007
DOI:10.1016/j.aca.2007.01.073
A sensitive and selective enzymatic kinetic method for the simultaneous determination of mixtures of carbaryl and phoxim pesticides was researched and developed. It was based on the inhibitory effect of the pesticides on acetylcholinesterase (AChE), and the use of 5,5′-dithiobis(2-nitrobenzoic) acid (DTNB) as a chromogenic reagent for the thiocholine iodide (TChI) released from the acetylthiocholine iodide (ATChI) substrate. The DTNB-thiocholine reaction was investigated by a spectrophotometric-kinetic approach. The complex rate equation for the formation of the chromogenic product, P, was solved under certain experimental conditions, which enabled the absorbance (AP, at λmax = 412 nm) from the mixtures of the two pesticide inhibitors to be directly related to their concentrations provided the absorbance additivity was followed. The spectra were measured for mixtures of carbaryl and phoxim at different concentrations, and at t = 904 s, T = 35 °C, pH = 7.5, cATChI = 0.14, and cAChE = 0.10 mg mL−1. The detection limits of the enzymatic kinetic spectrophotometric procedures for the determination of the carbaryl and phoxim were 4.7 and 0.59 μg L−1, respectively.Calibration models for chemometrics methods, such as principal component regression (PCR), partial least squares (PLS) and radial basis function-artificial neural network (RBF-ANN) were constructed and verified with synthetic samples of the mixtures of the two pesticides. The best performing model was based on the RBF-ANN method yielding at approximately 10 ppb analyte concentrations, %RPET (carbaryl = 5.2; phoxim = 6.5), %Recovery (approx.105%) and %RPET (6.5). Various spiked town-water samples produced recoveries in the range of 98.8–103% for each pesticide.
Co-reporter:Yongnian Ni, Shan Du, Serge Kokot
Analytica Chimica Acta 2007 Volume 584(Issue 1) pp:19-27
Publication Date(Web):12 February 2007
DOI:10.1016/j.aca.2006.11.006
The interaction of quercetin–Cu(II) complex with calf thymus DNA was investigated with the use of Neutral Red (NR) dye as a spectral probe by the application of UV–vis spectrophotometry, cyclic voltammetry and synchronous fluorescence spectroscopy. The results showed that both quercetin–Cu(II) complex and the NR molecule can intercalate into the double helix of the DNA. The 2:1 quercetin:Cu(II) complex (estimated binding constant = 2.85 × 10⁹) is stabilized by intercalation in the DNA (binding constant, K[quercetin–Cu(II)–DNA] = (1.82 ± 0.20) × 105 M−1), and displaces the NR dye from the NR–DNA complex in a competitive reaction. Cyclic voltammetry studies confirm the intercalation reaction and show that the ratio (KR/KO) of binding constants for the reduced and oxidized forms of the metal complex is 2.05. Furthermore, the alternative least squares (ALS) method was applied to resolve a complex two-way array of the absorption spectra data. This yielded the equilibrium concentration profiles of each component in the reaction (NR, NR–DNA and quercetin–Cu(II)) as well as the corresponding pure spectra. The extracted profiles showed that at equilibrium the [NR–DNA] and [NR] trends decreased and increased symmetrically, respectively, with approximately linear behaviour being observed below 10 × 10−6 mol L−1 of the added quercetin–Cu2+ complex. Thereafter, these trends converged asymptotically. The free [quercetin–Cu(II)] trend-line at equilibrium was linear over the whole range of the complex added. It was possible to estimate the approximate value of the equilibrium constant of the exchange process (approximately 5 × 10⁻¹) involving the intercalation of the quercetin–Cu(II) complex. It was also found that about 35% of the bound complex was unaccounted by the intercalation reaction, presumably being stabilized at an alternative site.
Co-reporter:Yongnian Ni, Yong Wang
Microchemical Journal 2007 Volume 86(Issue 2) pp:216-226
Publication Date(Web):August 2007
DOI:10.1016/j.microc.2007.03.008
A kinetic spectrophotometric method for the simultaneous determination of iodate and periodate in mixtures was proposed. The method is established on the different kinetic behaviours of the analytes which react with starch–iodide in the presence of sodium chloride in sulfuric acid medium. The kinetic data were collected from 260 to 900 nm every 10 nm, within a time range of 0–180 s at 1 s interval, and the absorbance collected at 291, 354 and 585 nm, respectively, increased linearly with the concentration between 0.1–1.2 mg L− 1 for both iodate and periodate. The mechanism investigation revealed that the iodate/periodate–iodide–starch system is a consecutive reaction. Subsequently, the mathematical model for the quantitative kinetic determination based on the consecutive reactions by utilizing chemometric methods was deduced, and the simultaneous determination of synthetic mixtures of iodate and periodate was then applied. Kinetic data collected at 291, 354 and 585 nm, were processed by chemometric methods, such as classical least square (CLS), principal component regression (PCR), partial least square (PLS), back-propagation artificial neural network (BP-ANN), radial basis function–artificial neural network (RBF-ANN) and principle component–radial basis function–artificial neural network (PC-RBF-ANN). The results showed that calibration model with the data collected at 354 nm had some advantages for the prediction of the analytes as compared with the ones of other two wavelengths, and the PLS and PC-RBF-ANN gave the lower prediction errors than other chemometric methods. The proposed method was applied to the simultaneous determination of iodate and periodate in several real samples; and the standard addition method yielded satisfactory recoveries in all instances.
Co-reporter:Yong Nian Ni, Xue Zhi Zhong
Chinese Chemical Letters 2007 Volume 18(Issue 5) pp:569-572
Publication Date(Web):May 2007
DOI:10.1016/j.cclet.2007.03.027
The binding characteristics of neutral red (NR) with DNA were investigated by fluorescence spectrometry. Chemometrics approach as singular value decomposition (SVD) was used to evaluate the number of spectral species in the drug–DNA binding process, and then the intrinsic binding constant of 1.6 × 10⁴ in base pairs and the binding site number of 0.97 were obtained from the Scatchard plot.
Co-reporter:Ping QIU, Yong-nian NI, Serge KOKOT
Chemical Research in Chinese Universities 2007 Volume 23(Issue 1) pp:14-17
Publication Date(Web):January 2007
DOI:10.1016/S1005-9040(07)60004-X
The presence of the pesticide ethion was determined using an electroanalytical method, i.e., linear sweep stripping voltammetry at a hanging mercury drop electrode in the Britton-Robbinson buffer with pH = 8.36, based on its reduction peak observed at - 690 mV following its alkaline hydrolysis. The experimental parameters, namely, the preconcentration potential, the preconcentration time, and the scan rate were investigated and - 300 mV (vs. Ag/AgCl), 270 s, and 100 mV/s were selected as the optimal values, respectively. The linear relationship between the peak current and the concentration was found to be in the range of 0.02-0.16 mg/L, with a detection limit of 0.0087 mg/L. The proposed method was applied to the determination of ethion in spiked vegetable and fruit samples via a preextraction with anhydrous ethanol.
Co-reporter:Yongnian Ni, Liangsheng Zhang, Jane Churchill, Serge Kokot
Talanta 2007 Volume 72(Issue 4) pp:1533-1539
Publication Date(Web):15 June 2007
DOI:10.1016/j.talanta.2007.02.003
In this paper, chemometrics methods were applied to resolve the high performance liquid chromatography (HPLC) fingerprints of complex, many-component substances to compare samples from a batch from a given manufacturer, or from those of different producers. As an example of such complex substances, we used a common Chinese traditional medicine, Huoxiang Zhengqi Tincture (HZT) for this research. Twenty-one samples, each representing a separate HZT production batch from one of three manufacturers were analyzed by HPLC with the aid of a diode array detector (DAD). An Agilent Zorbax Eclipse XDB-C18 column with an Agilent Zorbax high pressure reliance cartridge guard-column were used. The mobile phase consisted of water (A) and methanol (B) with a gradient program of 25–65% (v/v, B) during 0–30 min, 65–55% (v/v, B) during 30–35 min and 55–100% (v/v, B) during 35–60 min (flow rate, 1.0 ml min−1; injection volume, 20 μl; and column temperature-ambient). The detection wavelength was adjusted for maximum sensitivity at different time periods. A peak area matrix with 21 objects × 14 HPLC variables was obtained by sampling each chromatogram at 14 common retention times. Similarities were then calculated to discriminate the batch-to-batch samples and also, a more informative multi-criteria decision making methodology (MCDM), PROMETHEE and GAIA, was applied to obtain more information from the chromatograms in order to rank and compare the complex HZT profiles. The results showed that with the MCDM analysis, it was possible to match and discriminate correctly the batch samples from the three different manufacturers. Fourier transform infrared (FT-IR) spectra taken from samples from several batches were compared by the common similarity method with the HPLC results. It was found that the FT-IR spectra did not discriminate the samples from the different batches.
Co-reporter:Yongnian Ni, Zhengbao Qi, Serge Kokot
Chemometrics and Intelligent Laboratory Systems 2006 Volume 82(1–2) pp:241-247
Publication Date(Web):26 May 2006
DOI:10.1016/j.chemolab.2005.07.006
Anti-bacterial drugs such as sulfonamides and trimethoprim, are commonly used in medical and veterinary applications. The tablets often contain mixtures of drugs such as sulfadiazine, sulfadimidine, sulfamethoxazole, sulfanilamide and trimethoprim. Thus, a simple, rapid and inexpensive method for the simultaneous determination of these drugs was researched and developed with the aid of chemometrics methods comparing the classical least squares (CLS), principal component regression (PCR) and partial least squares (PLS) models. UV-spectra were collected in the 200–350 nm range from a set of samples containing aqueous ethanolic solutions (pH = 9.9) of drug mixtures prepared from the above compounds with the aid of an orthogonal array design. Initial studies of the UV-spectra of the individual compounds showed that satisfactory linear regression calibration models could be constructed in the concentration range of approximately 1.0–24.0 mg l− 1 for all compounds with LOD values in the range of ca. 0.2–1.0 mg l− 1 for each of the five drugs. These studies also indicated the significant spectral overlap of the UV- spectra of the drugs showing the need for chemometrics modeling for simultaneous analysis of the mixtures.Calibration models for the three multivariate methods were constructed with the use of the raw and derivative spectral data sets. These were verified with the aid of UV-spectral data obtained from a separately prepared set of drug mixture samples. The %RPE values for analysis of the individual drugs in mixtures were in the range of 2–10 with %Recoveries being close to 100 for the PCR and PLS models while the CLS method performed relatively poorly. The four PCR and the PLS models constructed could not be distinguished on prediction performance for practical purposes, and the PCR calibration based on the raw data matrix was utilised to illustrate successfully the application of the proposed method for analysis of the drugs in commonly available pharmaceutical tablets.
Co-reporter:Yongnian Ni, Daiqin Lin, Serge Kokot
Analytical Biochemistry 2006 Volume 352(Issue 2) pp:231-242
Publication Date(Web):15 May 2006
DOI:10.1016/j.ab.2006.02.031
Constant wavelength synchronous fluorescence spectroscopy (CW–SFS), UV–visible absorption spectroscopy, and cyclic and differential pulse voltammetry were applied to investigate the competitive interaction of DNA with the bis(1,10-phenanthroline)copper(II) complex cation ([Cu(phen)2]2+) and a fluorescence probe, neutral red dye (NR), in a tris–hydrogen chloride buffer (pH 7.4). The results show that both the [Cu(phen)2]2+and the NR molecules can intercalate competitively into the DNA double-helix structure. The cyclic voltammetry method showed that both anodic and cathodic currents of [Cu(phen)2]2+ decreased on addition of the DNA and the intercalated [Cu(phen)2]2+–DNA complex formed (β = (4.14 ± 0.24) × 103). CW–SFS measurements were facilitated by the use of the three-way resolution of the CW–SFS for NR, [Cu(phen)2]2+, and NR–DNA. The important constant wavelength (CW) interval, Δλ, was shown to vary considerably when optimized (135, 58, and 98 nm for NR, NR–DNA, and [Cu(phen)2]2+, respectively). This approach clearly avoided the errors that otherwise would have arisen from the common assumption that Δλ is constant. Furthermore, a chemometrics approach, parallel factor analysis (PARAFAC), was applied to resolve the measured three-way CW–SFS data, and the results provided simultaneously the concentration information for the three reaction components, NR, [Cu(phen)2]2+, and NR–DNA, for the system at each equilibrium point. The PARAFAC analysis indicated that the intercalation of the [Cu(phen)2]2+ molecule into the DNA proceeds by exchanging with the NR probe and can be attributed to two parallel reactions. Comprehensive information was readily obtained; the replacement of the intercalated NR commenced immediately on introduction of [Cu(phen)2]2+, approximately 50% of NR was replaced by [Cu(phen)2]2+ at a concentration of 0.45 × 10⁻⁵ mol L−1, and nearly all of the NR was replaced at a [Cu(phen)2]2+ concentration of 2.50 × 10⁻⁵ mol L−1. This work has the potential to improve extraction of information from the fluorescence intercalator displacement (FID) assay.
Co-reporter:Yongnian Ni, Yuerong Wang, Serge Kokot
Talanta 2006 Volume 69(Issue 1) pp:216-225
Publication Date(Web):15 March 2006
DOI:10.1016/j.talanta.2005.09.032
A linear sweep stripping voltammetric (LSSV) method has been researched and developed for simultaneous quantitative determination of mixtures of three antibiotic drugs, ofloxacin, norfloxacin and ciprofloxacin. It relies on reductive reaction of the antibiotics at a mercury electrode in a Britton–Robinson buffer (pH 3.78). The voltammograms of these three compounds overlap strongly, and show non-linear character. Thus, it is difficult to analyse the compounds individually in their mixtures. In this work, chemometrics methods such as classical least squares (CLS), principal component regression (PCR), partial least squares (PLS) and radial basis function-artificial neural networks (RBF-ANN) were applied for the simultaneous determination of these compounds. The prediction performance of the calibration models constructed on the basis of these methods was compared. It was shown that satisfactory quantitative results were obtained with the use of the RBF-ANN calibration model relative prediction error (RPET) of 8.1% and an average recovery of 101%. This method is able to accommodate non-linear data quite well. The proposed analytical method based on LSSV was applied for the analysis of ofloxacin, norfloxacin and ciprofloxacin antibiotics in bird feedstuffs and their spiked samples, as well as in eye drops with satisfactory results.
Co-reporter:Guowen Zhang, Yongnian Ni, Jane Churchill, Serge Kokot
Talanta 2006 Volume 70(Issue 2) pp:293-300
Publication Date(Web):15 September 2006
DOI:10.1016/j.talanta.2006.02.037
In food production, reliable analytical methods for confirmation of purity or degree of spoilage are required by growers, food quality assessors, processors, and consumers. Seven parameters of physico-chemical properties, such as acid number, colority, density, refractive index, moisture and volatility, saponification value and peroxide value, were measured for quality and adulterated soybean, as well as quality and rancid rapeseed oils. Chemometrics methods were then applied for qualitative and quantitative discrimination and prediction of the oils by methods such exploratory principal component analysis (PCA), partial least squares (PLS), radial basis function-artificial neural networks (RBF-ANN), and multi-criteria decision making methods (MCDM), PROMETHEE and GAIA.In general, the soybean and rapeseed oils were discriminated by PCA, and the two spoilt oils behaved differently with the rancid rapeseed samples exhibiting more object scatter on the PC-scores plot, than the adulterated soybean oil. For the PLS and RBF-ANN prediction methods, suitable training models were devised, which were able to predict satisfactorily the category of the four different oil samples in the verification set. Rank ordering with the use of MCDM models indicated that the oil types can be discriminated on the PROMETHEE II scale. For the first time, it was demonstrated how ranking of oil objects with the use of PROMETHEE and GAIA could be utilized as a versatile indicator of quality performance of products on the basis of a standard selected by the stakeholder. In principle, this approach provides a very flexible method for assessment of product quality directly from the measured data.
Co-reporter:Yongnian Ni, Ping Qiu, Serge Kokot
Analytica Chimica Acta 2005 Volume 537(1–2) pp:321-330
Publication Date(Web):29 April 2005
DOI:10.1016/j.aca.2004.12.080
Voltammetric behaviour of four carbamate pesticides, propoxur, isoprocarb, carbaryl and carbofuran, was investigated, and a method was developed for the simultaneous determination of these compounds. This was based on their anodic voltammetric behaviour observed following their alkaline hydrolysis, which produced electroactive phenol derivatives. It was found that by applying the differential pulse voltammertric (DPV) method in the presence of perchloric acid, the four compounds have well defined voltammetric oxidation waves with peak potentials at 712, 888, 664, and 688 mV, respectively. For each compound, a linear calibration was obtained in the concentration range of 1.0–30 mg l−1. Serious overlapping of individual voltammetric peaks was observed for the mixtures of these four compounds, and to facilitate the resolution of these complex voltammograms, different calibration models were investigated based on four different chemometrics methods, viz., classical least squares (CLS), principal component regression (PCR), partial least squares (PLS) and radial basis function-artificial neural networks (RBF-ANN). The prediction ability of these models were tested with the use of a data set constructed from synthetic solutions of the four pesticides. The analytical performance of the prediction models was characterized with the use of various figures of merit, and the best results were obtained with the PC-RBF-ANN method (%RPET = 5.6 and %Recovery (average) = 100). This method was then applied for the determination of the four pesticides in different water samples.
Co-reporter:Yongnian Ni, Guowen Zhang, Serge Kokot
Food Chemistry 2005 Volume 89(Issue 3) pp:465-473
Publication Date(Web):February 2005
DOI:10.1016/j.foodchem.2004.05.037
Maltol (MAL), ethyl maltol (EMA), vanillin (VAN) and ethyl vanillin (EVA) are food additives, and they have well defined UV spectra. However, these overlapped seriously, and it is difficult to determine them individually from their mixtures without a pre-separation. In this paper, chemometric approaches were applied to resolve the overlapping spectra and to determine these compounds simultaneously. The analysis of these four compounds was facilitated by the use of an orthogonal array data set consisting of absorption spectra in the 200–350 nm ranges obtained from a calibration set of mixtures containing these compounds. With this dataset, seven different chemometric models were built, such as classical least squares (CLS), principal components regression (PCR), partial least squares (PLS), and artificial neural networks (ANN). These chemometric models were then tested by the use of a validation dataset constructed from synthetic solutions of these four compounds. The analytical performance of these chemometric methods was characterized by relative prediction errors (RPE) and recoveries. The proposed methods were successfully applied to the analysis of commercial food samples. It was found that the radial basis function artificial neural networks (RBF-ANN) gave better results than other chemometric methods. PLS, PCR, DPLS, and DPCR also give satisfactory results, while CLS and DCLS perform poorer. It was also found that there was no advantage to pre-treat spectra by taking derivatives. The four compounds, when taken individually, behaved linearly in the 1.0–20.0 mg l−1 concentration range, and the limits of detection (LOD) for MAL, EMA, VAN and EVA were 0.39, 0.56, 0.49 and 0.38 mg l−1, respectively.
Co-reporter:Yongnian Ni, Daiqin Lin, Serge Kokot
Talanta 2005 Volume 65(Issue 5) pp:1295-1302
Publication Date(Web):15 March 2005
DOI:10.1016/j.talanta.2004.09.008
In this study, we have shown with the use of UV–vis spectrophotometry and the constant wavelength synchronous fluorescence spectroscopy (CW-SFS) techniques that the pharmaceutical drug, chlorpromazine hydrochloride (CPZ), intercalates into the deoxyribonucleic acid (DNA) double helix by partial exchange with the Neutral Red (NR) molecular probe.We have also demonstrated that with the use of three-way data plots, it is clear that it is important to have well-defined methodology for the selection of the important CW-SFS method parameter, Δλ. Ad hoc selection of this parameter, or even that based on experience, can readily lead to serious errors, which subsequently can be transferred to the interpretation of results. The said three-way plots provide a straightforward diagrammatic method, which improves the selection process of a satisfactory value for Δλ.Finally, we used PARAFAC modeling to resolve the complex three-way CW-SFS data, which provided simultaneously the concentration information for the three reaction components, NR, CPZ and NR-DNA, for the system at equilibrium. This PARAFAC analysis indicated that the intercalation of the CPZ molecule into the DNA proceeds by exchanging with the NR probe, and can be attributed to two parallel reactions.
Co-reporter:Yongnian Ni, Ping Qiu, Serge Kokot
Analytica Chimica Acta 2004 Volume 516(1–2) pp:7-17
Publication Date(Web):19 July 2004
DOI:10.1016/j.aca.2004.04.007
A differential pulse stripping voltammetry method (DPSV) is proposed for the determination of parathion-methyl (PTM), fenitrothion (FT) and parathion (PT) at a hanging mercury drop electrode (HMDE). The voltammograms of these three compounds overlap strongly, and it is difficult to determine the compounds individually from their mixtures. Quantitative analysis for each of the pesticide compounds in a mixture has been investigated with the aid of chemometrics and the prediction performance of the different methods such as classical least squares (CLS), principal component regression (PCR), partial least squares (PLS), Kalman filter (KF) and radial basis function-artificial neural networks (RBF-ANN), was compared. A set of synthetic mixtures of the three compounds was analysed by using the proposed methods, and it was found that the lowest relative prediction error (RPE) and satisfactory % recovery were achieved with the RBF-ANN procedure. The proposed method was also applied to several vegetable samples spiked with known amounts of the pesticides with satisfactory results.
Co-reporter:Yongnian Ni, Chunfang Huang, Serge Kokot
Chemometrics and Intelligent Laboratory Systems 2004 Volume 71(Issue 2) pp:177-193
Publication Date(Web):28 May 2004
DOI:10.1016/j.chemolab.2004.02.003
A method for the simultaneous determination of the pesticides, carbofuran, isoprocarb and propoxur in fruit and vegetable samples has been investigated and developed. It is based on reaction kinetics and spectrophotometry, and results are interpreted with the aid of chemometrics. The analytical method relies on the differential rates of coupling reactions between the hydrolysis product of each carbamate and 4-aminophenol in the presence of potassium periodate in an alkaline solution. The optimized method was successfully tested by analyzing each of the carbamates independently, and linear calibration models are described. For the simultaneous determinations of the carbamates found in ternary mixtures, kinetic and spectral data were processed either by three-way data unfolding method or decomposed by trilinear modeling. Subsequently, 10 different RBF-ANN, PARAFAC and NPLS calibration models were constructed with the use of synthetic ternary mixtures of the three carbamates, and were validated with a separate set of mixtures. The performance of the calibration models was then ranked on the basis of several different figures of merit with the aid of the multi-criteria decision making approach, PROMETHEE and GAIA. RBF-ANN and PC-RBF-ANN were the best performing methods with %Relative Prediction Errors (RPE) in the 3–4% range and Recovery of about 97%. When compared with other recent studies, it was also noted that RBF-ANN has consistently outperformed the more common prediction methods such as PLS and PCR as well as BP-ANN. The successful RBF–ANN method was then applied for the determination of the three carbamate pesticides in purchased vegetable and fruit samples.
Co-reporter:Yongnian Ni, Chunfang Huang, Serge Kokot
Analytica Chimica Acta 2003 Volume 480(Issue 1) pp:53-65
Publication Date(Web):17 March 2003
DOI:10.1016/S0003-2670(02)01654-9
A differential spectrophotometric method has been developed for the simultaneous quantitative determination of glucose (GLU), fructose (FRU) and lactose (LAC) in food samples. It relies on the different kinetic rates of the analytes in their oxidative reaction with potassium ferricyanide (K3Fe(CN)6) as the oxidant. The reaction data were recorded at the analytical wavelength (420 nm) of the K3Fe(CN)6 spectrum. Since the kinetic runs of glucose, fructose and lactose overlap seriously, the condition number was calculated for the data matrix to assist with the optimisation of the experimental conditions. Values of 80 °C and 1.5 mol l−1 were selected for the temperature and concentration of sodium hydroxide (NaOH), respectively. Linear calibration graphs were obtained in the concentration range of 2.96–66.7, 3.21–67.1 and 4.66–101 mg l−1 for glucose, fructose and lactose, respectively. Synthetic mixtures of the three reducing sugar were analysed, and the data obtained were processed by chemometrics methods, such as partial least square (PLS), principal component regression (PCR), classical least square (CLS), back propagation-artificial neural network (BP-ANN) and radial basis function-artificial neural network (RBF-ANN), using the normal and the first-derivative kinetic data. The results show that calibrations based on first-derivative data have advantages for the prediction of the analytes and the RBF-ANN gives the lowest prediction errors of the five chemometrics methods. Following the validation of the proposed method, it was applied for the determination of the three reducing sugars in several commercial food samples; and the standard addition method yielded satisfactory recoveries in all instances.
Co-reporter:Yongnian Ni, Shouhui Chen, Serge Kokot
Analytica Chimica Acta 2002 Volume 463(Issue 2) pp:305-316
Publication Date(Web):22 July 2002
DOI:10.1016/S0003-2670(02)00437-3
Metal ions such as Co(II), Ni(II), Cu(II), Fe(III) and Cr(III), which are commonly present in electroplating baths at high concentrations, were analysed simultaneously by a spectrophotometric method modified by the inclusion of the ethylenediaminetetraacetate (EDTA) solution as a chromogenic reagent. The prediction of the metal ion concentrations was facilitated by the use of an orthogonal array design to build a calibration data set consisting of absorption spectra collected in the 370–760 nm range from solution mixtures containing the five metal ions earlier. With the aid of this data set, calibration models were built based on 10 different chemometrics methods such as classical least squares (CLS), principal component regression (PCR), partial least squares (PLS), artificial neural networks (ANN) and others. These were tested with the use of a validation data set constructed from synthetic solutions of the five metal ions. The analytical performance of these chemometrics methods were characterized by relative prediction errors and recoveries (%). On the basis of these results, the computational methods were ranked according to their performances using the multi-criteria decision making procedures preference ranking organization method for enrichment evaluation (PROMETHEE) and geometrical analysis for interactive aid (GAIA). PLS and PCR models applied to the spectral data matrix that used the first derivative pre-treatment were the preferred methods. They together with ANN-radial basis function (RBF) and PLS were applied for analysis of results from some typical industrial samples analysed by the EDTA-spectrophotometric method described. DPLS, DPCR and the ANN-RBF chemometrics methods performed particularly well especially when compared with some target values provided by industry.
Co-reporter:Yongnian Ni, Li Wang, Serge Kokot
Analytica Chimica Acta 2001 Volume 431(Issue 1) pp:101-113
Publication Date(Web):8 March 2001
DOI:10.1016/S0003-2670(00)01319-2
The voltammetric behaviour of five nitro-substituted aromatic compounds, such as nitrobenzene, 2-, 3-, 4-nitrophenol and 2,4-dinitrophenol, was investigated, and a method was developed for the simultaneous determination of these compounds, based on their reduction at a hanging mercury drop electrode (HMDE). It was found that by applying the differential pulse voltammetric (DPV) approach in a Britton–Robinson buffer of pH 5.4, nitrobenzene, 2-, 3- and 4-nitrophenol had well defined voltammetric reduction waves with peak potentials at −344, −284, −292 and −376 mV, respectively. However, 2,4-dinitrophenol had two peaks with potentials at −240 and −364 mV under the same conditions. For each compound linear calibration graphs were obtained in the general concentration range of 0.05–3.0 mg l−1. In mixtures of the five compounds, serious overlapping of voltammetric peaks was observed, and with conventional analytical methodology pre-separation steps would be required. In this study, chemometrics methods of data analysis, such as partial least squares (PLS), principal component regression (PCR) and classical least squares (CLS), were applied to resolve the overlapped voltammograms. Orthogonal experimental design was used for construction of the training sets containing the five aromatic compounds in the concentration range of 0.1–2.6 mg l−1. Five significant factors or principal components were modelled for prediction by the PLS and PCR methods, respectively. The percent of relative prediction error (RPE) was similar and acceptable for both methods being approximately ±10%. The percent of recoveries were within ±10% of the target value. The CLS method performed poorly (RPET=38%). The developed method was then applied to the analysis of these nitro-substituted aromatic compounds in field samples with similar satisfactory results.
Co-reporter:Yongnian Ni, Li Wang, Serge Kokot
Analytica Chimica Acta 2001 Volume 439(Issue 1) pp:159-168
Publication Date(Web):17 July 2001
DOI:10.1016/S0003-2670(01)01038-8
The voltammetric behavior of antipsychotic drugs, such as, chlorpromazine hydrochloride and promethazine hydrochloride has been investigated at a glassy carbon electrode in Britton–Robinson buffer of pH 9. It was found by applying the differential pulse stripping voltammetry (DPSV) that both chlorpromazine hydrochloride and promethazine hydrochloride had well formed oxidation voltammetric waves, with the peak potential for chlorpromazine hydrochloride at 620 mV, and for the two peaks of promethazine hydrochloride at 444 and 668 mV. The calibrations were linear for chlorpromazine hydrochloride and promethazine hydrochloride in the concentration ranges of 0.05–1.2 and 0.1–1 mg l−1, respectively. However, the voltammetric peaks of these two drugs, seriously overlap and it is difficult to determine them individually from a response of a drug mixture. In this work, a method for the simultaneous determination of these two drugs is proposed, and is based on their oxidation at the glassy carbon electrode. The interpretation of the complex voltammograms is achieved with the aid of chemometric methods, such as, classical least squares (CLS), principal component regression (PCR) and partial least squares (PLS). The proposed method was applied to determine these two drugs in a set of synthetic mixtures and blood samples, and in general, satisfactory results were obtained.
Co-reporter:Yongnian Ni, Chao Liu, Serge Kokot
Analytica Chimica Acta 2000 Volume 419(Issue 2) pp:185-196
Publication Date(Web):1 September 2000
DOI:10.1016/S0003-2670(00)00978-8
A kinetic spectrophotometric method has been developed for simultaneous quantitative determination of acetaminophen and phenobarbital in pharmaceutical preparations, and relies on the different kinetic rates of the analytes in their oxidative coupling reaction with 3-methylbenzothiazolin-2-one hydrazone (MBTH) in the presence of hydrochloric acid and the Fe(III) oxidant. The absorbance was measured and recorded from 440 to 740 nm every 60 s from 15 to 435 s. An artificial neural network (ANN) coupled with principal component analysis (principal component artificial neural network, PC-ANN) has been described, and its principles and applications were illustrated by a simulated kinetic system. The performance of the PC-ANN was compared with a conventional ANN model. PC-ANN, as well as ANN and partial least squares (PLS), were applied to a validation set of overlapping spectra containing kinetic data of binary mixtures with different concentration ratios of acetaminophen and phenobarbital. The results show that PC-ANN is the most efficient of the three chemometrics methods applied for prediction of the two analytes.
Co-reporter:Yongnian Ni, Li Wang, Serge Kokot
Analytica Chimica Acta 2000 Volume 412(1–2) pp:185-193
Publication Date(Web):8 May 2000
DOI:10.1016/S0003-2670(00)00720-0
The voltammetric behavior of synthetic food antioxidants, such as butylated hydroxyanisole (BHA), butylated hydroxytoluene (BHT), propyl gallate (PG) and tert-butylhydroquinone (TBHQ), at a glassy carbon electrode in solution of 0.1 mol l−1 perchloric acid containing 1% methanol has been investigated. The obtained linear sweep voltammograms (LSV) showed that all these four compounds have well-defined oxidation waves with peak potentials of 629, 818, 599 and 501 mV for BHA, BHT, PG and TBHQ, respectively. Linear calibration graphs were also obtained in the concentration ranges of 0.5–15.0, 0.5–8.0, 1.0–15.0 and 1.0–15.0 mg l−1 for BHA, BHT, PG and TBHQ, respectively. However, the voltammetric peaks of these antioxidants seriously overlap and it is difficult to determine them individually from a mixture without prior separation. In this work, a method for simultaneous determination of these antioxidants, based on their oxidation at the glassy carbon electrode, with the aid of chemometric approaches, such as classical least squares (CLS), principal component regression (PCR) and partial least squares (PLS), has been developed. The method was applied to determine the four antioxidants in a set of synthetic mixtures and several commercial food samples; in general, satisfactory results were obtained.
Co-reporter:Yong Wang, Baohui Li, Yongnian Ni, Serge Kokot
Chemometrics and Intelligent Laboratory Systems (15 January 2014) Volume 130() pp:
Publication Date(Web):15 January 2014
DOI:10.1016/j.chemolab.2013.11.002
•Single- and multi-wavelength HPLC methods are used for fingerprint analysis.•Icoshift, an ultra rapid and versatile Algorithm is used for the alignment of HPLC profile.•Chemometrics are improved and applied to practical analysis of complex substances.•Radix Paeoniae herbs with different species and geographical origins are classified.Single-wavelength high performance liquid chromatography-diode-array-detector (HPLC-DAD) and multi-wavelength combined HPLC methods were researched and developed in order to compare their performance for the classification of complex substances. Thus, the aims of this work were: to compare the performance of the single- and multi-wavelength HPLC-DAD methods for analysis of complex substances – in this context, the Radix Paeoniae herbs, which were classified on the basis of their component species and geographical origin. Three classification methods, Linear discriminant analysis (LDA), Radial basis function artificial neural network (RBF-ANN) and Least squares-support vector machine (LS-SVM), were compared on the basis of their performance in discriminating the Radix Paeoniae samples. The results showed that the multi-wavelength data produced better classification results of the two HPLC methods. This was so, irrespective of the chemometrics method used. However, the LS-SVM models were significantly better in classifying the herb samples. Consequently, the multi-wavelength HPLC-DAD approach is a strong alternative to the more common single-wavelength method, and the LS-SVM was the method of choice for classification of the complex substances such as the Radix Paeoniae herbs.
Co-reporter:Yongnian Ni, Baohui Li and Serge Kokot
Analytical Methods (2009-Present) 2012 - vol. 4(Issue 12) pp:NaN4333-4333
Publication Date(Web):2012/11/01
DOI:10.1039/C2AY25950H
Performance of a novel analytical method for complex samples, based on combined or fused high-performance liquid chromatography (HPLC) and Fourier transform infrared spectroscopy (FT-IR) data, was compared with that based on measurements from either of the techniques. The analytes were different varieties of Radix Paeoniae (Shaoyao), traditional Chinese medicines (TCM), from various regions. When the HPLC and FT-IR datasets (L and R) were separately submitted to either PCA or several supervised classification and prediction methods, the recognition rates were unsatisfactory. Thus, the potential of combined data of these two techniques was investigated, and two statistical methods for reducing the dimensions of the fused data were developed based on: (i) four PCs from the L and R matrices, and (ii) selection of optimum variables by the genetic algorithm-partial least squares (GA-PLS). PCA of these two fused sets indicated improved discrimination of the different sample clusters. Subsequent application of the supervised classification and prediction methods—linear discriminant analysis (LDA), least squares-support vector machine (LS-SVM), and radial basis function neural network (RBF-ANN)—indicated significantly higher recognition rates. Thus, the best discrimination of the complex Shaoyao TCM samples on the basis of their variety and geographical origin, was obtained with the use of non-linear RBF-ANN and LS-SVP models.
Co-reporter:
Analytical Methods (2009-Present) 2013 - vol. 5(Issue 21) pp:
Publication Date(Web):
DOI:10.1039/C3AY40985F
Standard chemical methods of analysis for marker alkaloids and flavonoids such as rutin, apigenin, quercetin, kaempferol, and leonurine were insufficient to discriminate the geographical origins of the complex Herba leonuri (HL) samples. This led to the research and development of a novel, quantitative HPLC fingerprint method for the simultaneous analysis of the content of important markers present in the HL samples. Seven HPLC peaks were selected and a structure was assigned to five. Fifty-six HL samples collected from three provinces, Anhui, Hubei, and Jiangxi, were analyzed by the above HPLC method and the resulting 56 × 7 matrix of the HPLC fingerprints and the seven marker compounds was submitted to principal component analysis (PCA) with consequent discrimination of the HL samples according to their geographical origins; interestingly, it was found that the highly correlated L6 (kaempferol) and L7 (apigenin) loadings were independent of the other five marker compound loadings (L1–L5). In addition, the L6 and L7 variables were related only to the Jiangxi group, while the L1–L5 loadings were associated with Jiangxi and Anhui; the Hubei cluster was not directly related to any loading. For quantitative analysis, the least squares-support vector machine (LS-SVM) calibration model was able to predict 94.4% of the samples correctly.
Co-reporter:
Analytical Methods (2009-Present) 2014 - vol. 6(Issue 18) pp:
Publication Date(Web):
DOI:10.1039/C4AY01222D
An efficient method for the analysis of hydroquinone at trace levels in water samples has been developed in the form of a fluorescent probe based on graphene quantum dots (GQDs). The analytical variable, fluorescence quenching, was generated from the formation of benzoquinone intermediates, which formed during the catalytic oxidation of hydroquinone by horseradish peroxidase (HRP). In general, the reaction mechanism involved hydroquinone, as an electron acceptor, which affected the surface state of GQDs via an electron transfer effect. The water-soluble GQDs were directly prepared by the pyrolysis of citric acid and with the use of the mentioned hybrid enzyme system, the detection limit for hydroquinone was as low as 8.4 × 10⁻⁸ M. Furthermore, this analysis was almost unaffected by other phenol and quinine compounds, such as phenol, resorcinol and other quinines, and therefore, the developed GQD method produced satisfactory results for the analysis of hydroquinone in several different lake water samples.
Co-reporter:Yongnian Ni, Na Deng and Serge Kokot
Analytical Methods (2009-Present) 2010 - vol. 2(Issue 9) pp:
Publication Date(Web):
DOI:10.1039/C0AY00213E
Co-reporter:Yongnian Ni, Yi Gui and Serge Kokot
Analytical Methods (2009-Present) 2011 - vol. 3(Issue 2) pp:NaN392-392
Publication Date(Web):2010/12/14
DOI:10.1039/C0AY00445F
Three structurally similar catecholamines, adrenaline (AA), dopamine (DA) and noradrenaline (NA), which are neurotransmitters well known for their treatment of neural disorders and many other diseases, were investigated at a glassy carbon electrode (GCE) with the use of differential pulse stripping voltammetry (DPSV). The aim was to develop a simple, rapid and cost effective method of simultaneous analysis of these three substances in typical samples such as human urine. Each analyte showed typical reversible redox behaviour with the use of cyclic voltammetry in aqueous medium in the pH range of 4.0–7.9, and composite voltammograms of the three analytes were found to consist of three significantly overlapping peaks corresponding to the three individual substances. Thus, two- and three-way multi-variate data analysis methods were investigated. These included unfolding methods such as—partial least squares (UPLS), principal component regression (UPCR) and radial basis function-artificial neural networks (URBF-ANN), as well as trilinear models, such as parallel factor analysis (PARAFAC) and N-way PLS (NPLS). The results were compared with those obtained from two-way voltammetric data matrix with the use of conventional models, PLS, PCR and RBF-ANN. It was found that most of the three-way models, such as PARAFAC and UPLS, performed somewhat better than others on the basis of the %RPET (5.6∼5.9) and mean %Recovery (94∼102). The proposed methods were then applied for the determination of human urine samples spiked with the three catecholamines, and the results were satisfactory.

![1,3-Naphthalenedicarboxylic acid, 2-(3,4-dihydroxyphenyl)-1,2-dihydro-7,8-dihydroxy-, 1,3-bis[1-carboxy-2-(3,4-dihydroxyphenyl)ethyl] ester](/data/chemimg/103800/389065-74-1.png)
![1,3-Naphthalenedicarboxylic acid, 2-(3,4-dihydroxyphenyl)-1,2-dihydro-7,8-dihydroxy-, 1,3-bis[1-carboxy-2-(3,4-dihydroxyphenyl)ethyl] ester](/data/chemimg/103800/389065-74-1_b.png)
![1-Oxaspiro[2.5]octane, 5,5-dimethyl-4-(3-methyl-1,3-butadien-1-yl)-](http://img.cochemist.com/ccimg/926000/925919-79-5.png)
![1-Oxaspiro[2.5]octane, 5,5-dimethyl-4-(3-methyl-1,3-butadien-1-yl)-](http://img.cochemist.com/ccimg/926000/925919-79-5_b.png)


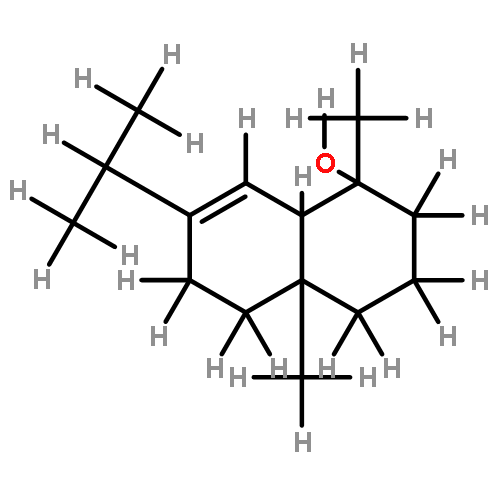
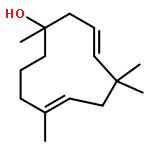
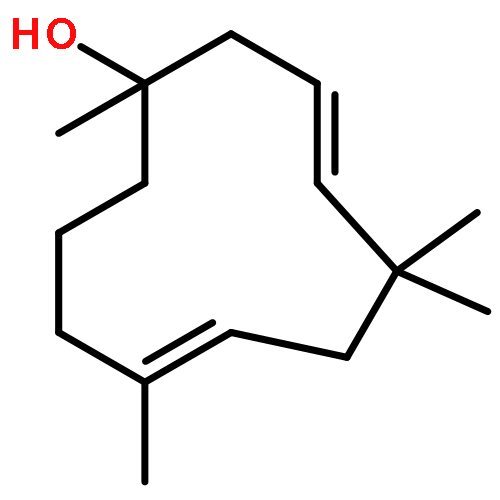
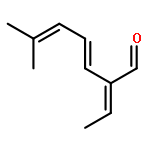
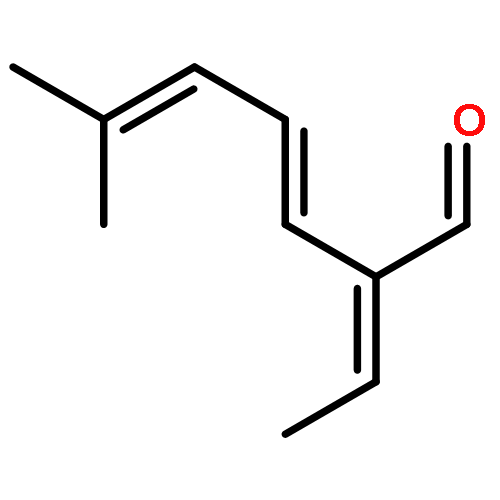
![Acetic acid, 1,7,7-trimethyl-bicyclo[2.2.1]hept-2-yl ester](http://img.cochemist.com/ccimg/92700/92618-89-8.png)
![Acetic acid, 1,7,7-trimethyl-bicyclo[2.2.1]hept-2-yl ester](http://img.cochemist.com/ccimg/92700/92618-89-8_b.png)


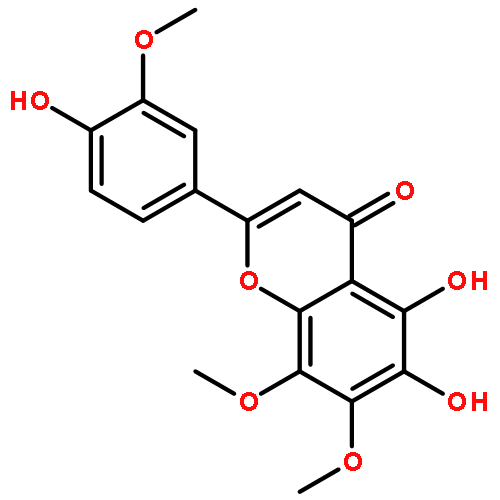

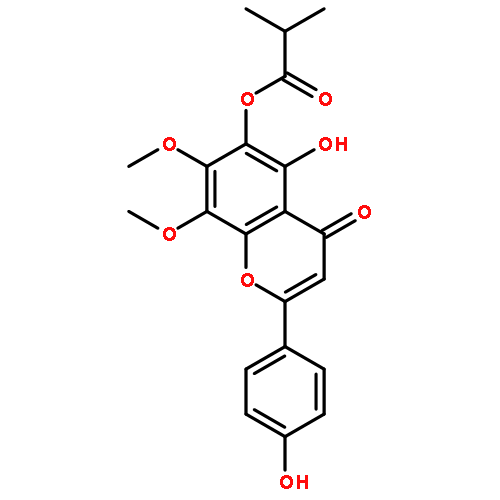


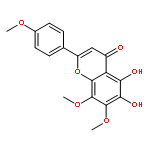
![Bicyclo[4.1.0]heptane,7-(1-methylethylidene)-](http://img.cochemist.com/ccimg/53300/53282-47-6.png)
![Bicyclo[4.1.0]heptane,7-(1-methylethylidene)-](http://img.cochemist.com/ccimg/53300/53282-47-6_b.png)


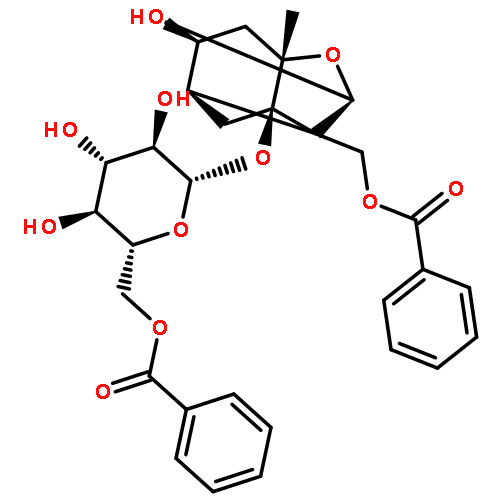

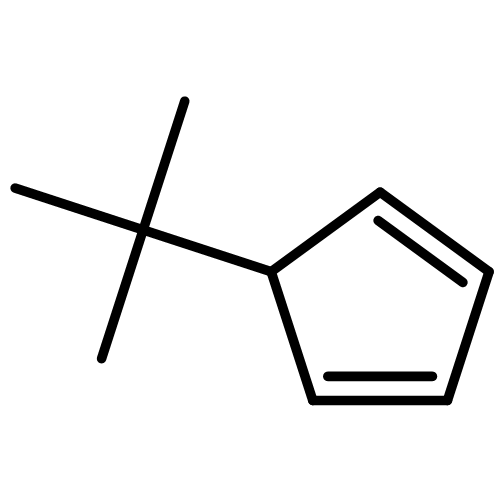
![4,6,6-trimethylbicyclo[3.1.1]hept-3-en-2-yl acetate](http://img.cochemist.com/ccimg/33600/33522-69-9.png)
![4,6,6-trimethylbicyclo[3.1.1]hept-3-en-2-yl acetate](http://img.cochemist.com/ccimg/33600/33522-69-9_b.png)
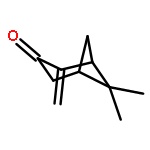
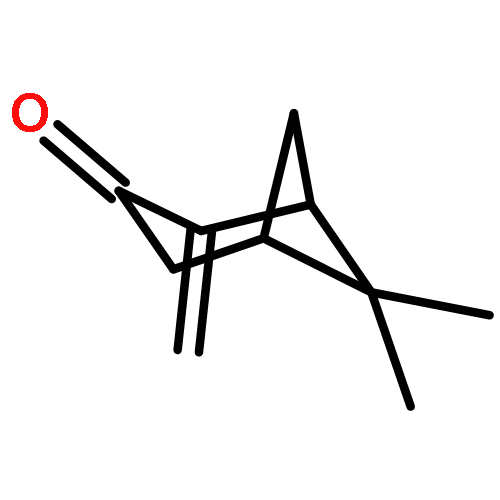
![Bicyclo[4.1.0]hept-2-ene,4,7,7-trimethyl-](http://img.cochemist.com/ccimg/29100/29050-33-7.png)
![Bicyclo[4.1.0]hept-2-ene,4,7,7-trimethyl-](http://img.cochemist.com/ccimg/29100/29050-33-7_b.png)
![(2s,3s)-4-[(e)-3-[(1r)-1-carboxy-2-(3,4-dihydroxyphenyl)ethoxy]-3-oxoprop-1-enyl]-2-(3,4-dihydroxyphenyl)-7-hydroxy-2,3-dihydro-1-benzofuran-3-carboxylic Acid](http://img.cochemist.com/ccimg/28900/28831-65-4.png)
![(2s,3s)-4-[(e)-3-[(1r)-1-carboxy-2-(3,4-dihydroxyphenyl)ethoxy]-3-oxoprop-1-enyl]-2-(3,4-dihydroxyphenyl)-7-hydroxy-2,3-dihydro-1-benzofuran-3-carboxylic Acid](http://img.cochemist.com/ccimg/28900/28831-65-4_b.png)


![Cyclohexene, 3-(1,5-dimethyl-4-hexenyl)-6-methylene-, [S-(R*,S*)]-](http://img.cochemist.com/ccimg/20400/20307-83-9.png)
![Cyclohexene, 3-(1,5-dimethyl-4-hexenyl)-6-methylene-, [S-(R*,S*)]-](http://img.cochemist.com/ccimg/20400/20307-83-9_b.png)
![4-(5-(Bis(2-chloroethyl)amino)-1-methyl-1H-benzo[d]imidazol-2-yl)butanoic acid](http://img.cochemist.com/ccimg/16600/16506-27-7.png)
![4-(5-(Bis(2-chloroethyl)amino)-1-methyl-1H-benzo[d]imidazol-2-yl)butanoic acid](http://img.cochemist.com/ccimg/16600/16506-27-7_b.png)


![(1α,2β,5α)-2-methyl-5-(1-methylethyl)bicyclo[3.1.0]hexan-2-ol](http://img.cochemist.com/ccimg/15600/15537-55-0.png)
![(1α,2β,5α)-2-methyl-5-(1-methylethyl)bicyclo[3.1.0]hexan-2-ol](http://img.cochemist.com/ccimg/15600/15537-55-0_b.png)


![Cyclobuta[1,2:3,4]dicyclopentene,decahydro-3a-methyl-6-methylene-1-(1-methylethyl)-, (1S,3aS,3bR,6aS,6bR)-](http://img.cochemist.com/ccimg/5300/5208-59-3.png)
![Cyclobuta[1,2:3,4]dicyclopentene,decahydro-3a-methyl-6-methylene-1-(1-methylethyl)-, (1S,3aS,3bR,6aS,6bR)-](http://img.cochemist.com/ccimg/5300/5208-59-3_b.png)


![Bicyclo[4.1.0]heptan-3-ol,4,7,7-trimethyl-, (1R,3S,4R,6S)-](http://img.cochemist.com/ccimg/4100/4017-93-0.png)
![Bicyclo[4.1.0]heptan-3-ol,4,7,7-trimethyl-, (1R,3S,4R,6S)-](http://img.cochemist.com/ccimg/4100/4017-93-0_b.png)
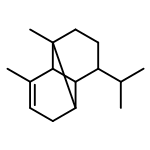
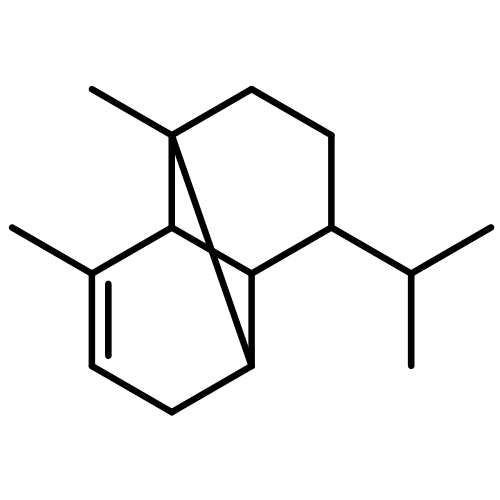


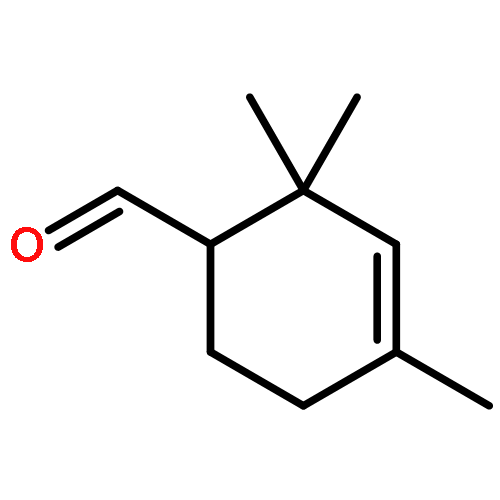


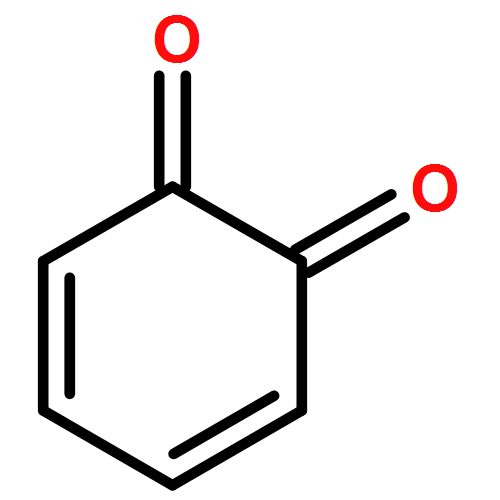
![2(3H)-Furanone,dihydro-3,4-bis[(4-hydroxy-3-methoxyphenyl)methyl]-, (3R,4R)-](http://img.cochemist.com/ccimg/600/580-72-3.png)
![2(3H)-Furanone,dihydro-3,4-bis[(4-hydroxy-3-methoxyphenyl)methyl]-, (3R,4R)-](http://img.cochemist.com/ccimg/600/580-72-3_b.png)


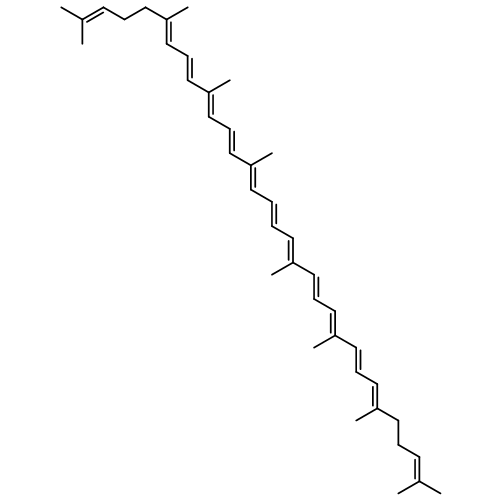
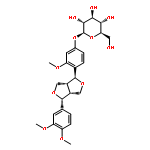
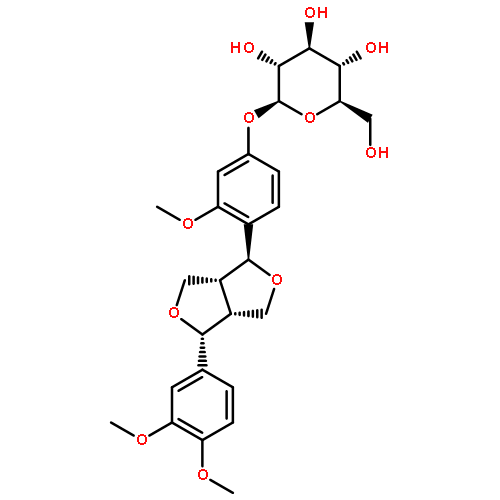
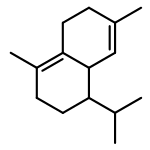
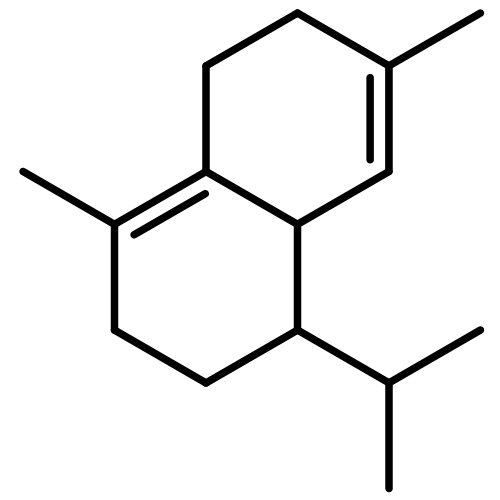


![5-hydroxy-2-(4-methoxyphenyl)-7-[(2s,3r,4s,5s,6r)-3,4,5-trihydroxy-6-[[(2r,3r,4r,5r,6s)-3,4,5-trihydroxy-6-methyloxan-2-yl]oxymethyl]oxan-2-yl]oxychromen-4-one](http://img.cochemist.com/ccimg/500/480-36-4.png)
![5-hydroxy-2-(4-methoxyphenyl)-7-[(2s,3r,4s,5s,6r)-3,4,5-trihydroxy-6-[[(2r,3r,4r,5r,6s)-3,4,5-trihydroxy-6-methyloxan-2-yl]oxymethyl]oxan-2-yl]oxychromen-4-one](http://img.cochemist.com/ccimg/500/480-36-4_b.png)

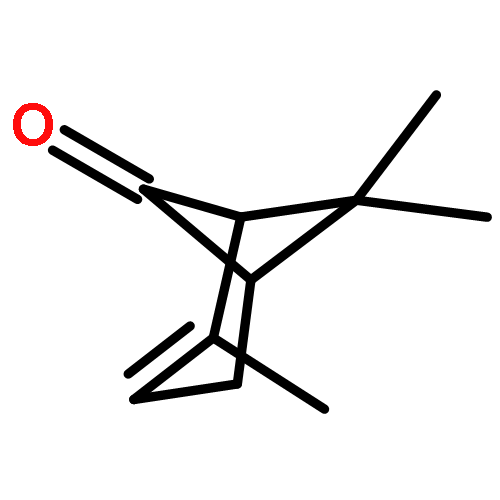
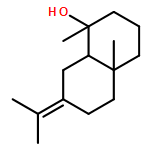

![Bicyclo[2.2.1]heptane, 7,7-dimethyl-2-methylene-](http://img.cochemist.com/ccimg/500/471-84-1.png)
![Bicyclo[2.2.1]heptane, 7,7-dimethyl-2-methylene-](http://img.cochemist.com/ccimg/500/471-84-1_b.png)

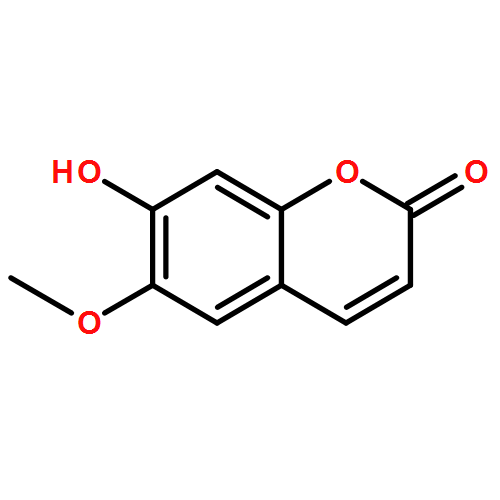


![Benzenemethanol, 4-amino-3,5-dichloro-α-[[(1,1-dimethylethyl)amino]methyl]-](/data/chemimg/568900/37148-27-9.png)
![Benzenemethanol, 4-amino-3,5-dichloro-α-[[(1,1-dimethylethyl)amino]methyl]-](/data/chemimg/568900/37148-27-9_b.png)